Data Analysis Platform
What is it?
A data analysis platform provides:
- Shared repository for data
- Shared library for analysis scripts
- Runtime environment
- Task scheduler
Advantages
A Data Analysis platform is conducive for the work of data managers and statisticians. It encourages collaboration, helps eliminate redundant work, and alleviates some versioning issues. Teams always know where to find the master data. They can easily view, review, test and run code written by teammates. The task scheduler allows cascades of analytic scripts to be automatically run relative to work cycles.
Example: SISCOVE Data Analysis Platform
The analysis platform has a web interface with two main pages:
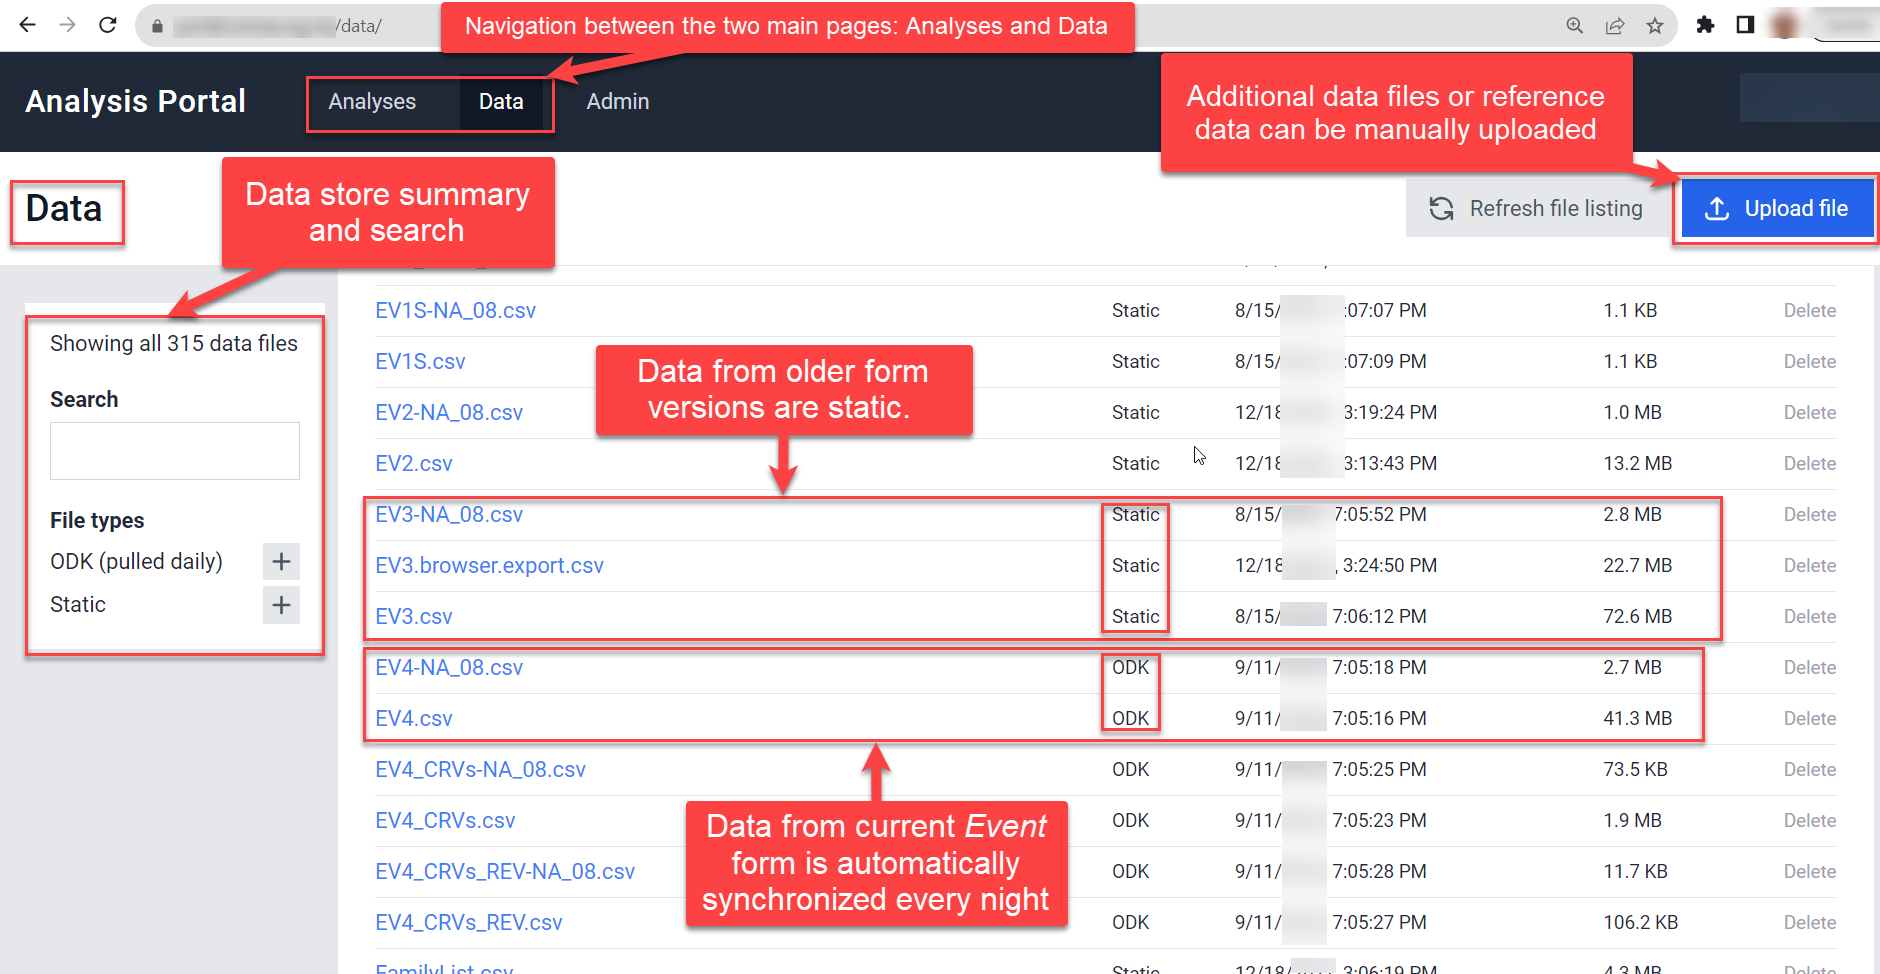
- Data: A flat file storage area with automated daily synchronization (one way) from Data Collection server.
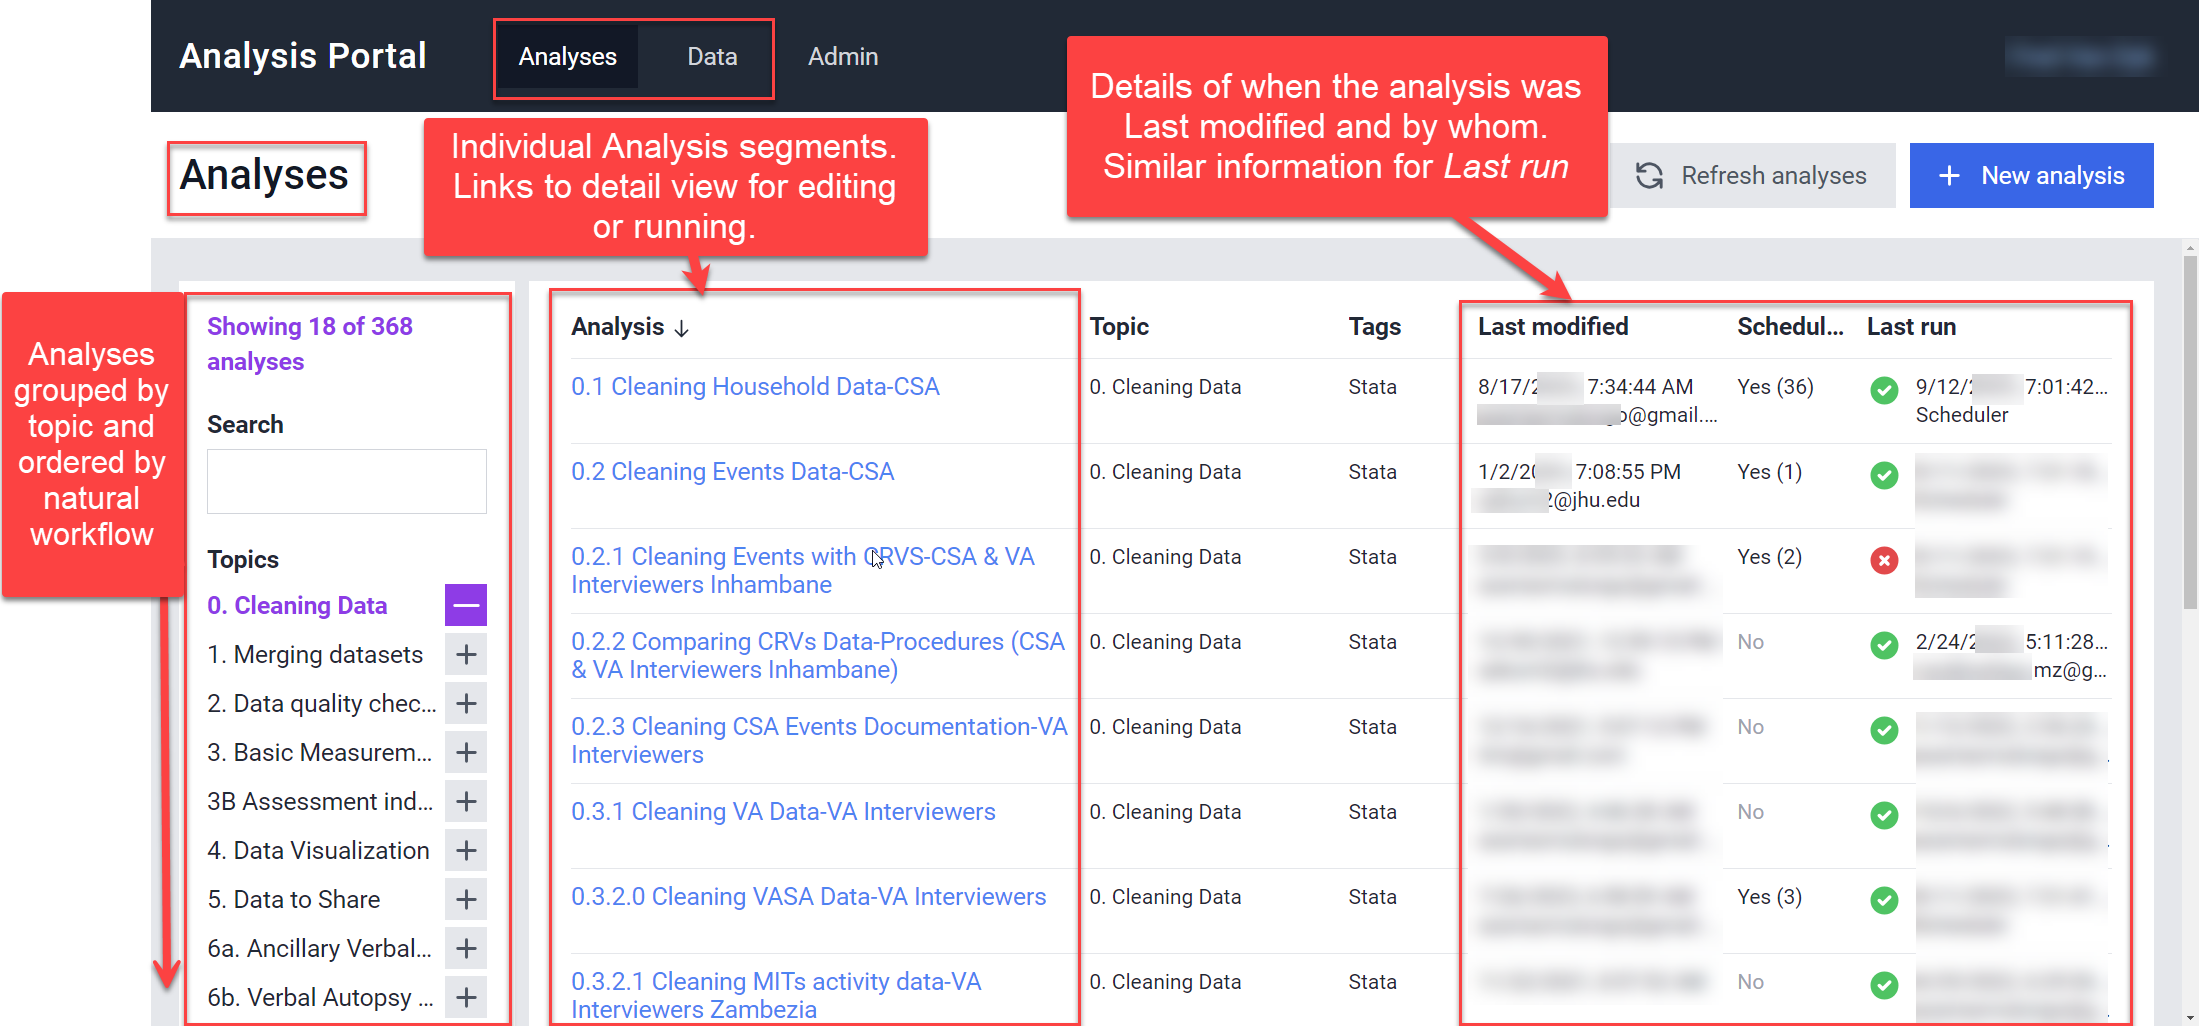
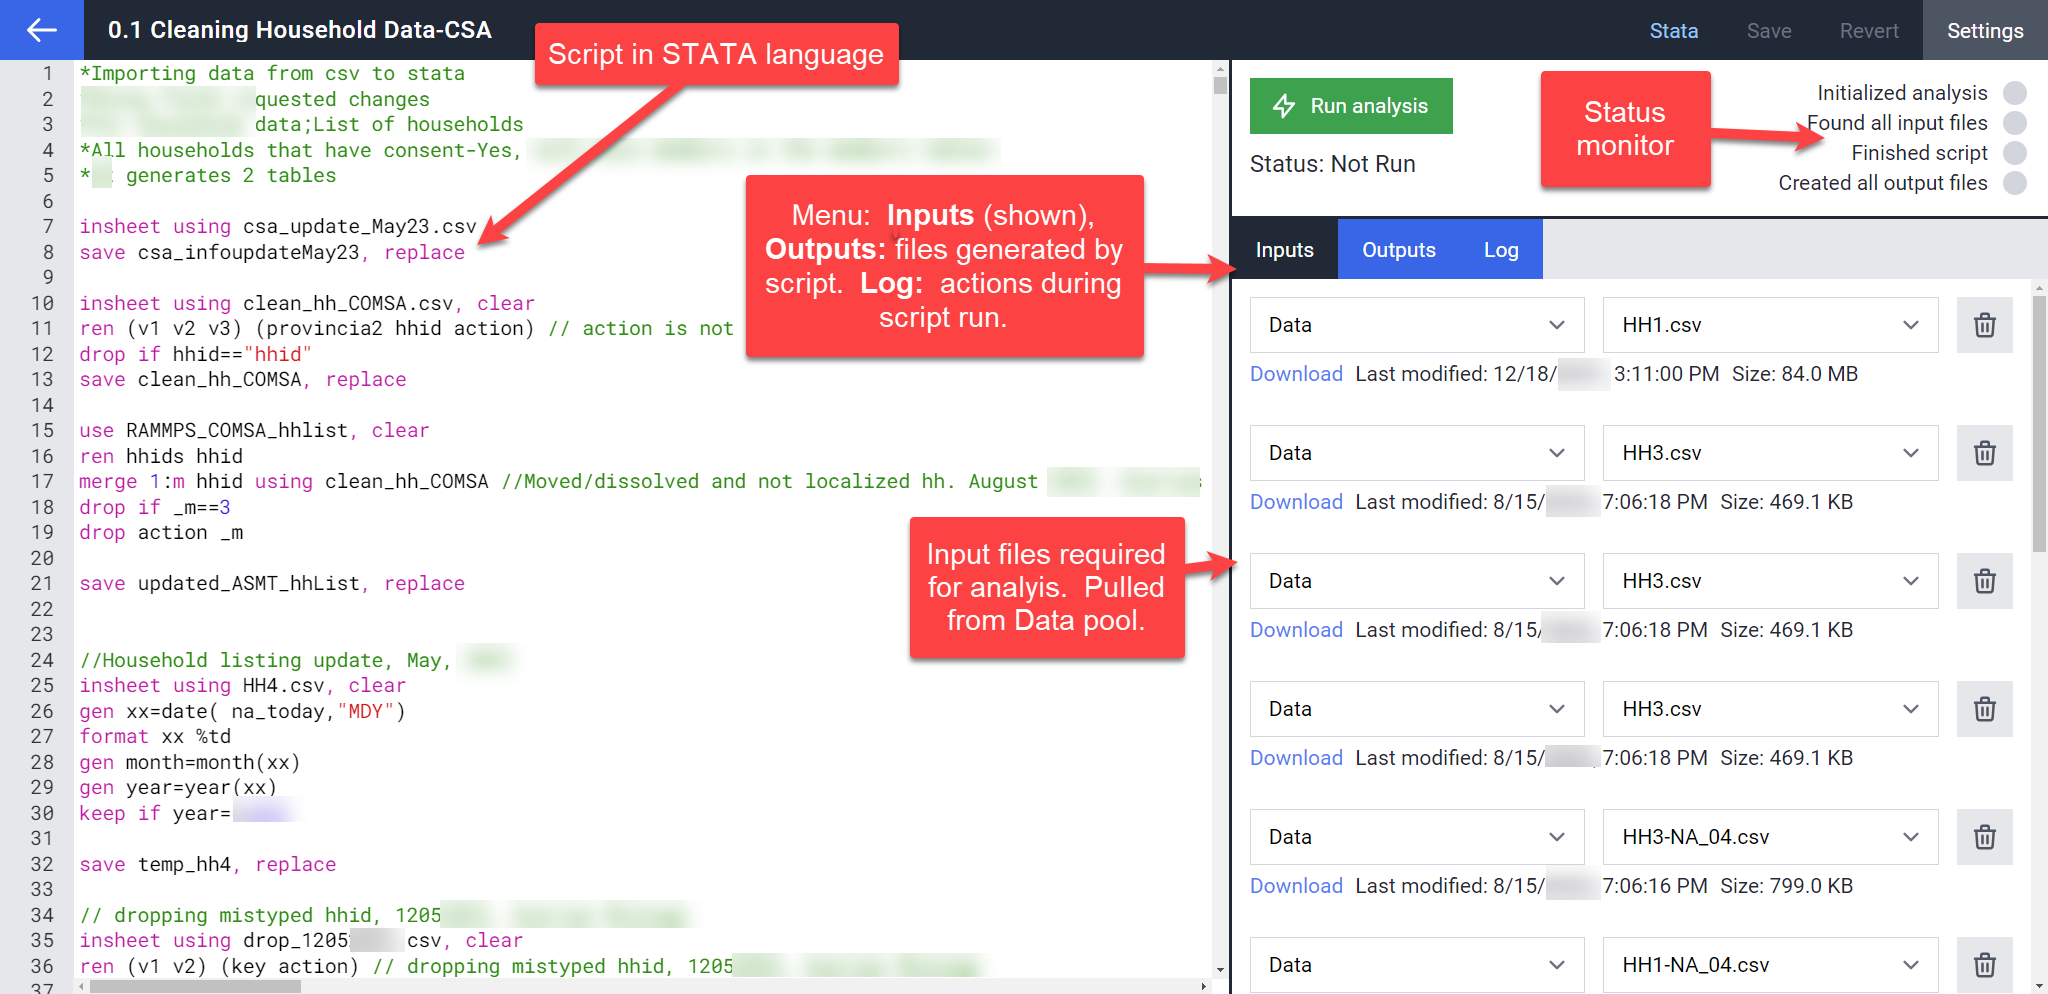
- Analyses: A library of scripts written in STATA and R.
Key features:
- Role-based access
- Automated daily synchronization
- Task scheduler for automated running of scripts in sequence
- Shared repository of data and analytic scripts
- Operational reporting
- Error Correction
- Statistical Analysis
- Creation of datasets for sharing to external systems (CRVS, CHAMPS, DHIS2)
- Creation of Graphs, Figures, and Visualizations
Github Repository comsa-portal:
The following screenshots are from the SISCOVE/COMSA portal. The code for this system is available by request. Please email viva@jh.edu to request access. Credit Tim Roberton
SISCOVE Portal web page: Data Repository
SISCOVE Portal web page: Analysis Script Library
SISCOVE Portal web page: Edit and Run Scripts
| Last updated |
|---|
| Aug 1, 2025 |