Data Analysis and Dissemination
Step 11
Data analysis for the SMSS has two broad purposes:
- Monitoring and supporting data collection
- Sharing results with in-country and global stakeholders.
This section focuses on the 2nd item. It describes the data analysis for generating mortality, cause specific rates, and other relevant indicators for use by stakeholders. Reviewing Data collection and generating quality assurance data were introduced in step 10.
Intranet for Data Analysis
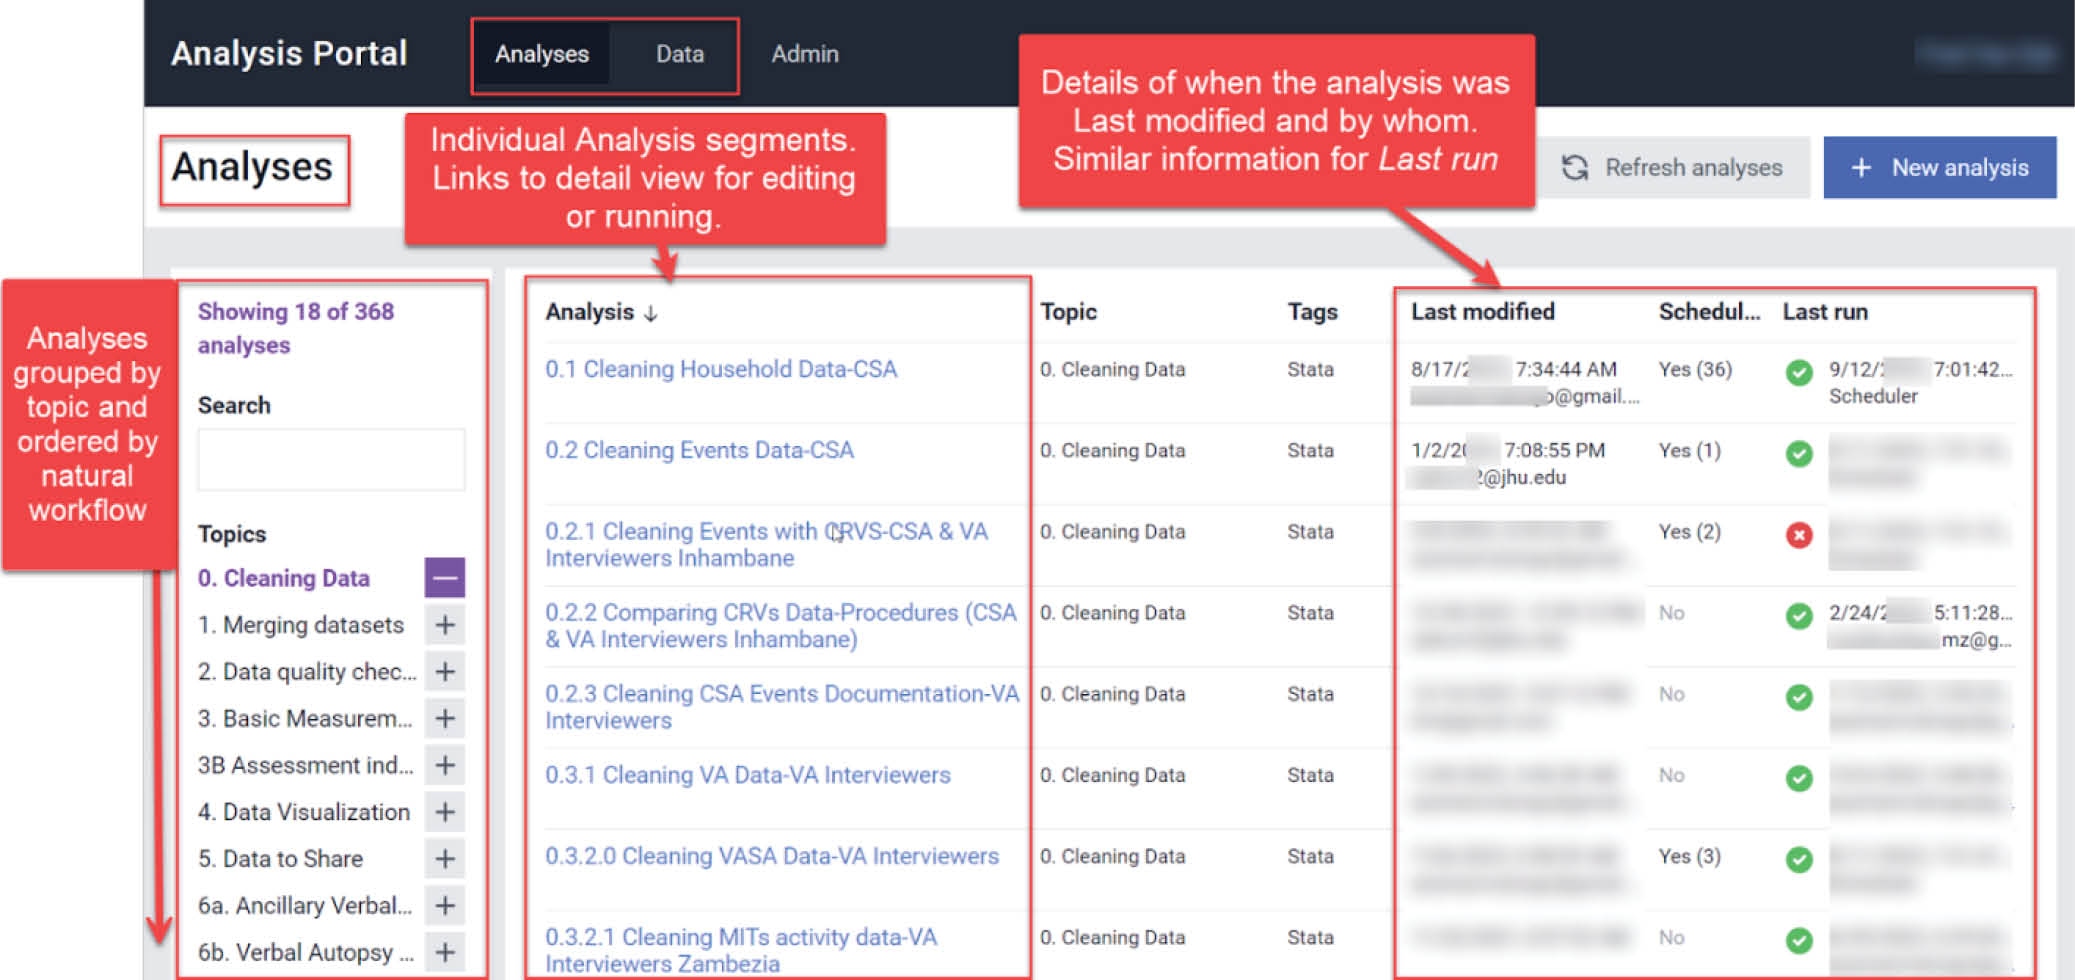
To promote collaborative work across the project, a friendly web-portal can be used to store cleaned data, standard statistical codes, and ad-hoc analysis. Such a portal allows for rapid response to queries, promotes reproducibility, and helps keep track of various analyses being conducted by the project team. Step 5 describes the configuration of the portal.
As part of the SIS-COVE in Mozambique, raw data is routinely cleaned, reshaped and fed into a portal that allows for remote collaboration on data analysis and archives all analyses so that they can be easily reproduced. The portal is used as a common platform for data management and analysis. Clear rules must be established with regard to where each data processing activity takes place, with a guided naming and numbering of conventions, including how to edit codes.
Intranet for Data Analysis for SIS-COVE in Mozambique
Mortality Data
The following are descriptions of the basic mortality indicators and disaggregators that are routinely calculated by the system, under the categories of population characteristics, vital events and rates.
Population Composition — The characteristics of population composition can be disaggregated by age and sex, residence area and province or region.
Vital events — The proportion of births (live births, stillbirths, miscarriages) and deaths can be disaggregated by age and sex, residence area and province or region.
Rates — The reliability of the indicators will be assessed by computing the standard error of the estimates and hence the confidence intervals of the population parameters. Main indicators are: crude birth rate (CBR), crude death rate (CDR), total fertility rate (TFR), infant mortality rate (IMR), neonatal mortality rate (NMR), post-neonatal mortality rate (PNMR), child mortality rate (CMR), under-5 mortality rate (U5MR), stillbirth rate (SBR), perinatal mortality rate (PMR), age-specific mortality rate (ASMR). See list of indicators and definitions. https://www.dropbox.com/scl/fo/qi0myakpt1a6tz53o16bt/ANfR6PyKCnd-DVSd3E3zhBA?dl=0
Analysis of Verbal and Social Autopsy Data
Multiple methods have been developed for the analysis of the verbal autopsy data to determine a population-based cause of death distribution. These methods include physician coding of VA cause of death (PCVA) and computer coded VA methods (CCVA). While PCVA relies on physicians’ review of the VA data and attribution of a likely cause of death, CCVA uses expert defined computer algorithms to assign the likely cause of death from the VA data.1 The most popular CCVA methods include InterVA, InsilicoVA, Expert Algorithm VA, SmartVA (or Tariff), etc.2 3 4 All methods have their advantages and limitations. However, the use of CCVA approaches ensures objectivity and rapid analysis of the data. The WHO now endorses and recommends several CCVA methods, many of which are included in OpenVA software that is currently run with the R statistical package. PCVA is resource intensive, diverts physicians from their clinical duties, can be biased by varied clinical experiences of the physician coders, and lacks objectivity and uniform application of diagnostic criteria. Nevertheless, some researchers favor PCVA, and some settings might prefer it. 5
Assigning Causes of Death
Causes of death (COD) can be assigned to each death case by using several CCVA methods. The Mozambique COMSA/SIS-COVE uses three different CCVA algorithms: InterVA5, InSilicoVA, and the Verbal Autopsy Expert Algorithm (EAVA). All three CCVA algorithms are comparable, reproducible, timely, and feasible in low-resource settings. The algorithms differ in how they use and how they determine causes of death. For each death, any two or all three algorithm cause assignments may agree or be discrepant, based on responses to symptom information from the WHO 2016 Verbal Autopsy interview. It can be beneficial to use more than one algorithm to obtain causes, since it is not certain which will produce the most accurate COD estimates, and there are trade-offs for each. For example, InterVA has been developed over many years and is widely used and validated. However, InterVA5 does not distinguish between a symptom which is missing (“don’t know”, “refused to answer”) and absent (“No”). InSilicoVA takes missing versus absent responses into account and eliminates “Undetermined” but requires relatively more computational time. The cause-given symptom relationship of EAVA is the most transparent and it is intuitive, but the hierarchy of causes used strongly affects outcomes. Improvements in all three algorithms are ongoing. InterVA5 and InSilicoVA require the OpenVA package, and all three algorithms are run using R statistical software.
Verbal autopsy data are run through a series of scripts to assign a cause of death. The first step is to adapt variable names and response options so that they align with CCVA algorithm input formats. Peter Byass’s InterVA-5.1 User Guide provides helpful guidance on the data inputs required by the algorithms. The table between pages 11 and 12 translates the WHO 2016 variable names into those used by InterVA5 and InSilicoVA. For example, to convert the variables and values from the WHO 2016 VA questionnaire format to the OpenVA R package format question Id10019 - What is the sex of the deceased? - is re-coded into two Yes or No questions: i019a and i019b. Response values are “Y” if male and “N” if female for i019a, and “N” if male and “Y” if female for i019b. Missing, don’t know, and refusal are coded as a dot “.” This mapping process must be done manually and checked regularly, as incoming data are updated. The VA questionnaire variables and responses remain in their collection format for EAVA. The EAVA algorithm creates a database indicating a diagnosis is either present or absent, based on reported symptoms. Causes are then assigned for each age group based on a hierarchy of causes.
Once the specific cause has been determined by InterVA, InSilicoVA, and EAVA for each death, causes are grouped into the broader cause categories by age group. Broad neonatal causes are typically congenital malformation, infection, intra-partum related events, prematurity, and all other causes. Broad child causes are malaria, pneumonia, diarrhea, severe malnutrition, HIV, other infections, and others. Adult causes include cancer, diarrhea, HIV, injury, malaria, maternal causes, other, other infections, pneumonia, tuberculosis, and cardiovascular diseases.
Social Autopsy Analysis
While knowledge of the biological causes of child death is important, effective delivery of survival interventions depends on better understanding of modifiable cultural, social and health system factors affecting health care access and utilization. Social autopsy instruments collect the data needed to connect the fatal illness or the act of diagnosing or recognizing that illness to a set of socio–demographic, economic, and cultural conditions or factors, thereby making a social “diagnosis” of the deaths.6 A descriptive analysis is conducted of the data on preventive and curative care, guided by the coverage of key indicators along the continuum of normal care (for children under-five years of age) and the steps of illness recognition and care-seeking for illnesses in the Pathway to Survival model. 7
Social autopsy findings detail:
- Household-level factors like mother’s and father’s education, pregnancy and wellness care, care seeking and constraints;
- Community factors such as residence place, time to reach health care in an emergency, and social capital;
- And health system factors such as antenatal care content, delivery care, newborn and child care, and illness care seeking
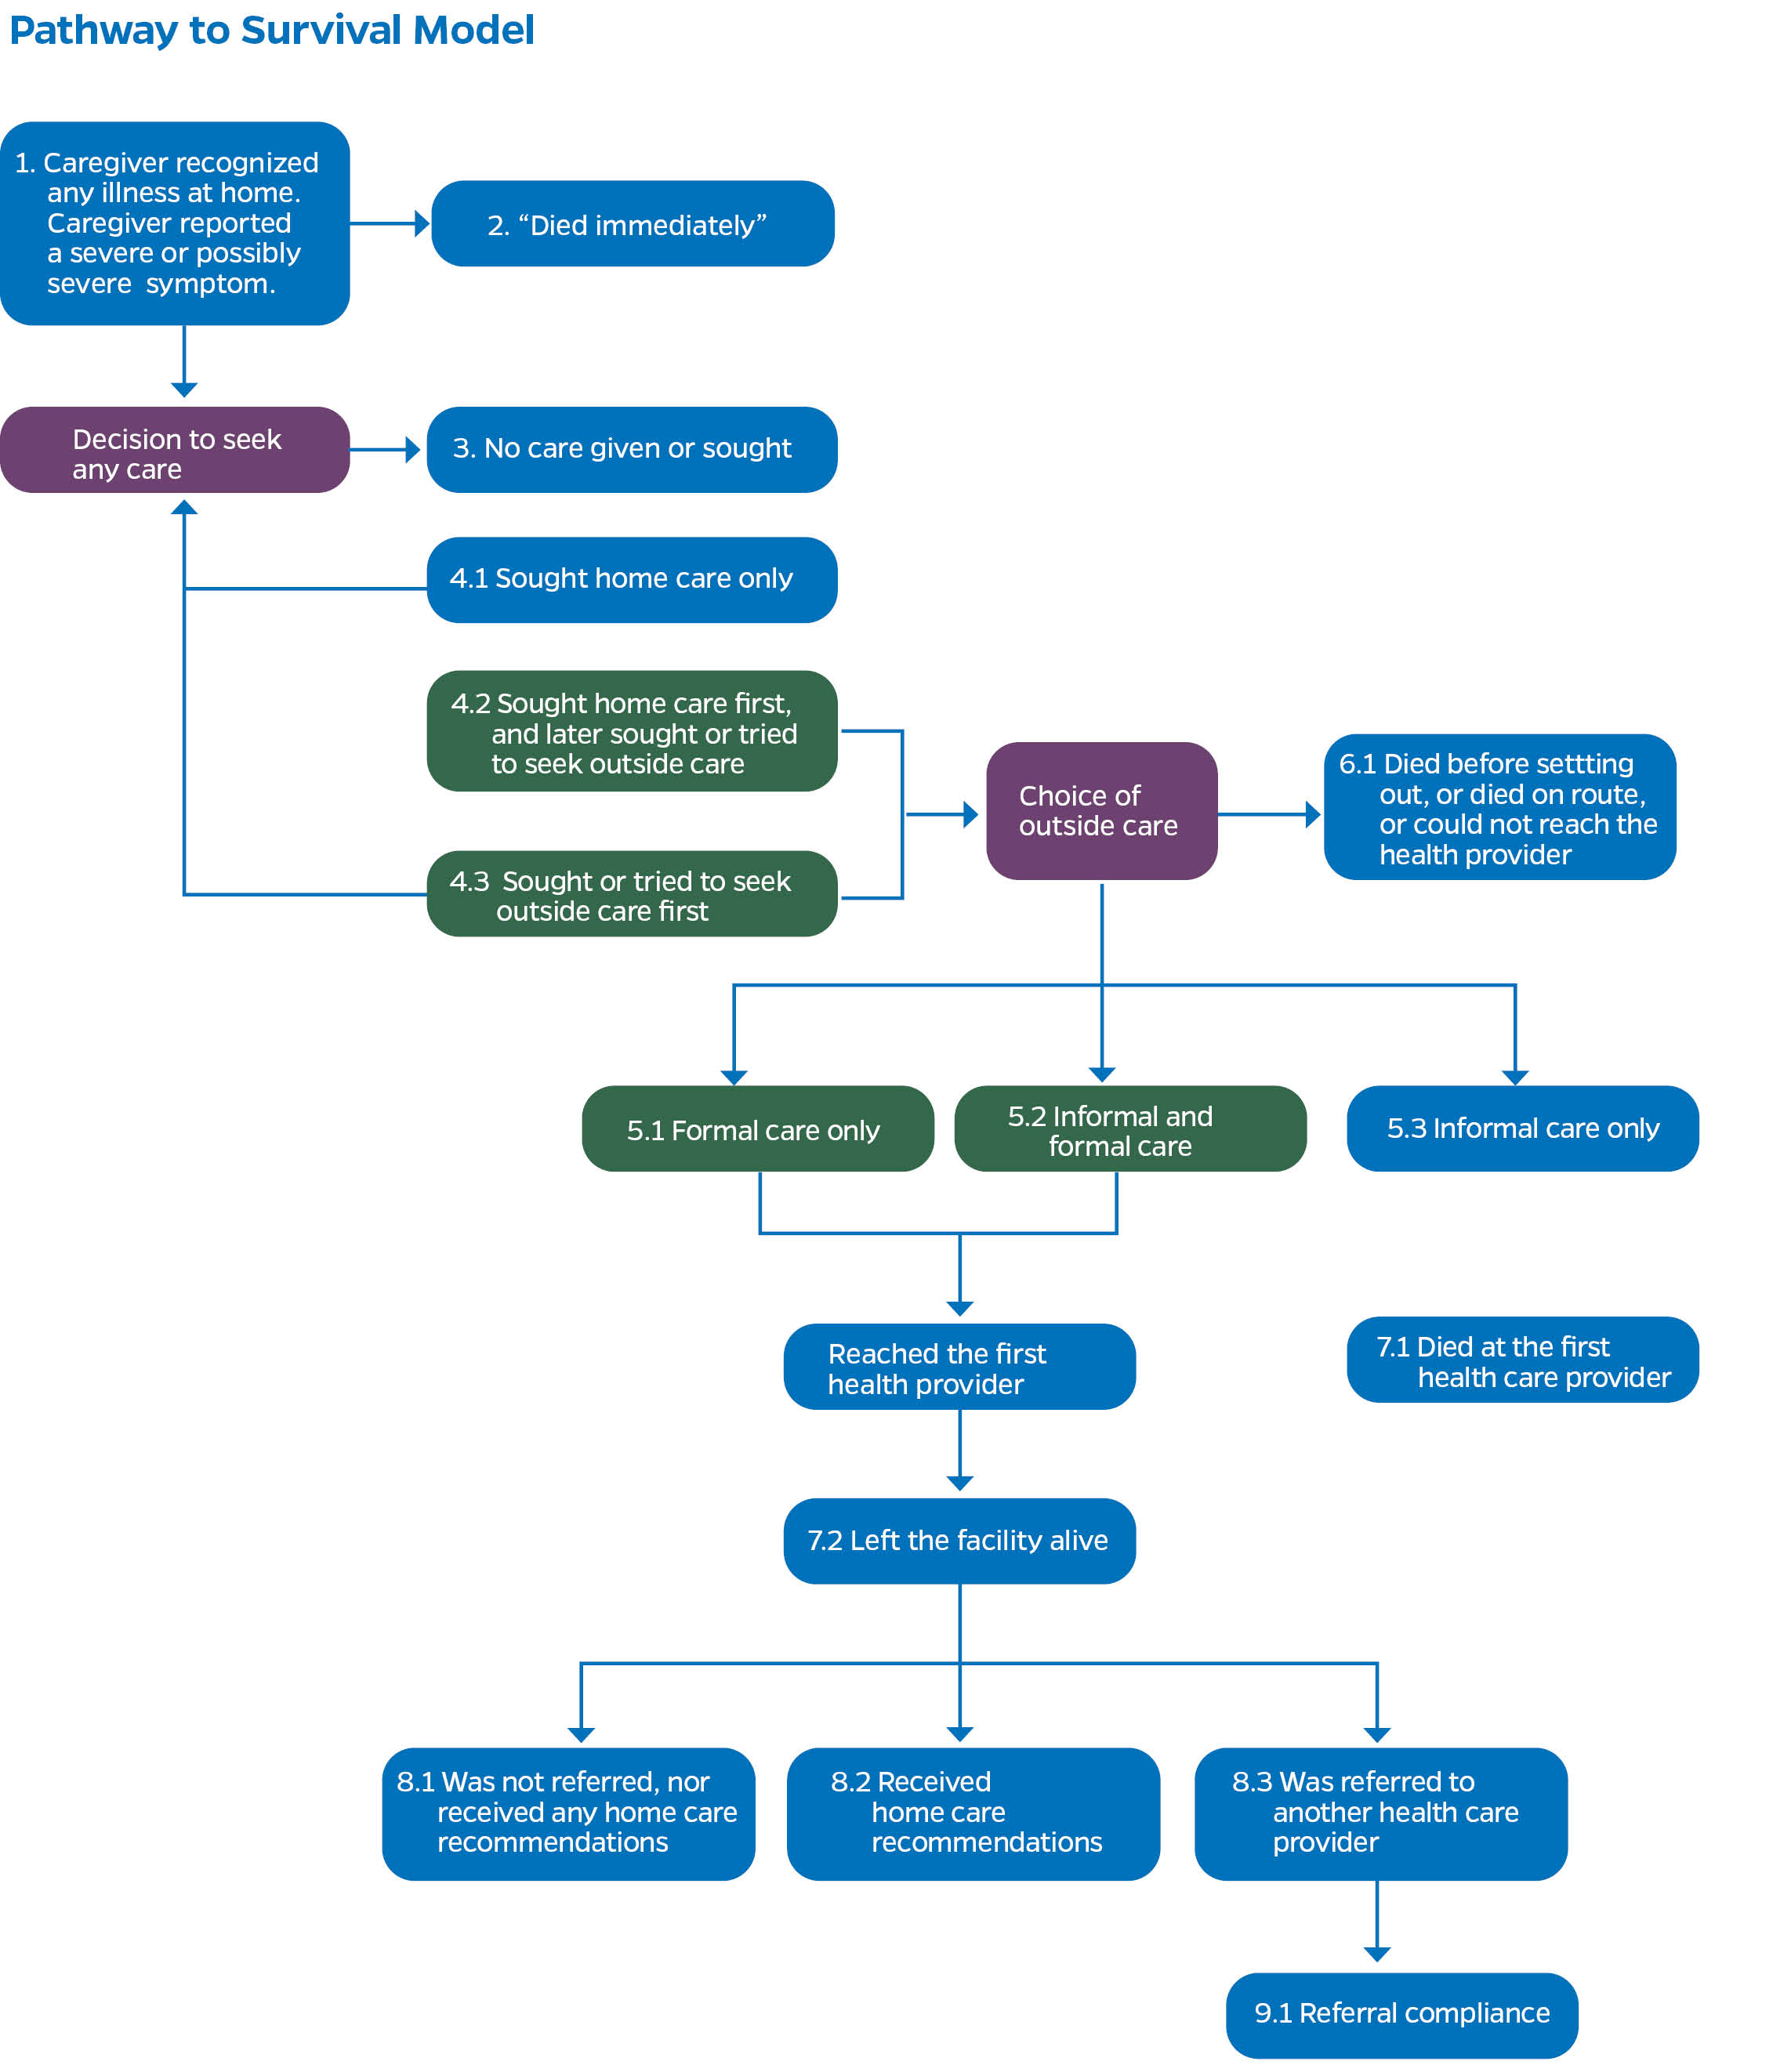
The “Pathway to Survival” conceptual framework is used to organize the steps that families, communities and health systems must take to prevent illness and return sick children to health. Social autopsy findings are useful for guiding effective delivery of child survival strategies by informing health policy and program development for increased access and utilization of preventive and curative health care.
For neonates, in addition to examining the coverage of illness recognition, caregiving, care–seeking and quality health care provision at each step along the Pathway to Survival, we assess the neonates’ median age in days at illness onset, defined as the age when the first symptoms of the fatal illness were recognized, the median illness duration in days, defined as the time from illness onset till death, and caregivers’ perception of the children’s illness severity at onset, when first deciding to seek formal health care, and at discharge from the first formal provider.
We present some of the key frameworks used to organize the Social Autopsy indicators. While most of the frameworks were originally designed to support the integrated management of childhood illness approach to child health care, they can also be used to describe an approach to overcoming adult mortality.
Demographic and Household Characteristics of the Deceased
This is presented as a descriptive table that depicts the socio-demographic characteristics of the respondents, the deceased, and their households.
The characteristics of the respondents include their age, education and or literacy, marital status, etc. The deceased’s characteristics, include age, gender, age at illness onset, education, marital status, etc. Household characteristics concern household possession, the use of improved drinking water sources, the use of improved sanitation sources, the use of electricity / generator/solar for lightning, floor and walls characteristics, the wealth index quintile, household density, and travel time to the nearest health facility, etc.
Pathway to Survival
Pathway to Survival identifies and organizes social, cultural and health system factors that could be modified both inside the home and in the community in order to prevent child illness and return sick children to health. 8 The Pathway to Survival model describes these healthful preventive and curative care practices. While originally designed to support the Integrated Management of Childhood Illness (IMCI) approach to child health care, the model can also be used to describe an approach to overcoming much of adult mortality. The SA questions in the COMSA/SIS-COVE questionnaire are based on this model.
Coverage of key Indicators along the Continuum of Care (for Total Under-five years of age)
Implicit in the Pathway to Survival is the continuum of care that has been a recurrent theme in the maternal, newborn and child health literature.9 The interventions reviewed in the continuum of care and related to the Pathway to Survival framework are classified according to service delivery strategies across the continuum and include key preventative interventions, either inside or outside the home, for which a reasonable level of evidence of efficacy is present and that support the people’s wellness.10 11 All the examined interventions have been shown to be efficacious and effective in promoting child survival and thus are included among the interventions examined by the Lives Saved (LiST) tool 12 or recommended by the World Health Organization (WHO), and so should be accessible to all children.
Table 1: Coverage Indicators of Selected Interventions Along the Continuum of Care from Pregnancy to Postnatal Periods for Stillbirth and Neonatal Deaths 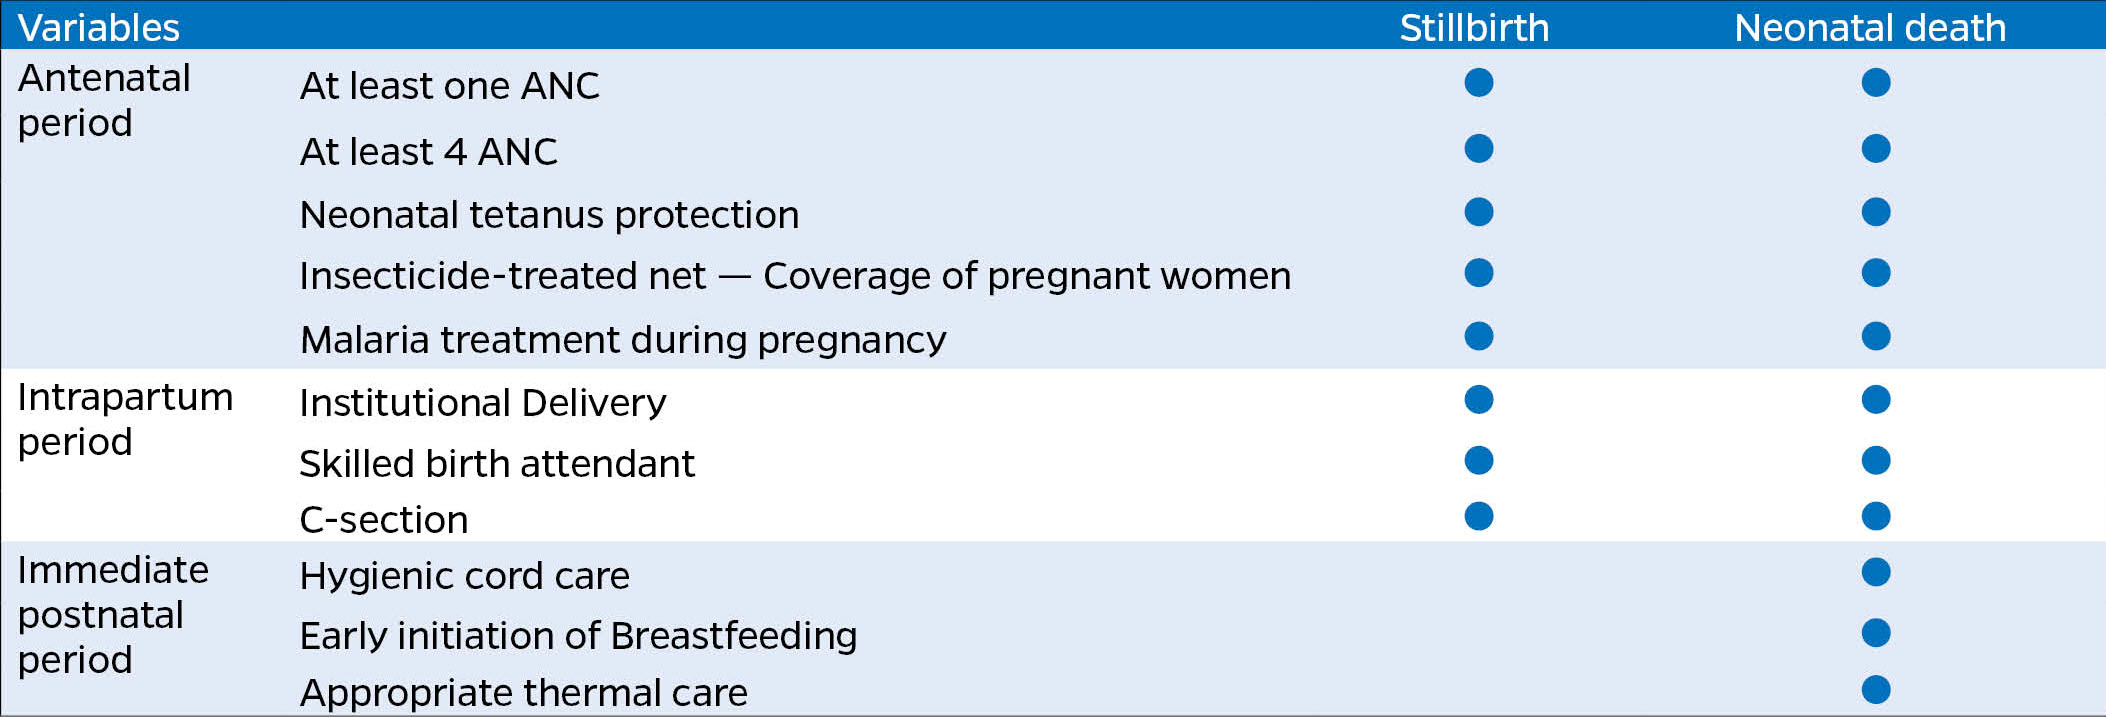
Table 2: Coverage Indicators of Selected Interventions Along the Continuum of Care for Children 1-59 Months Old 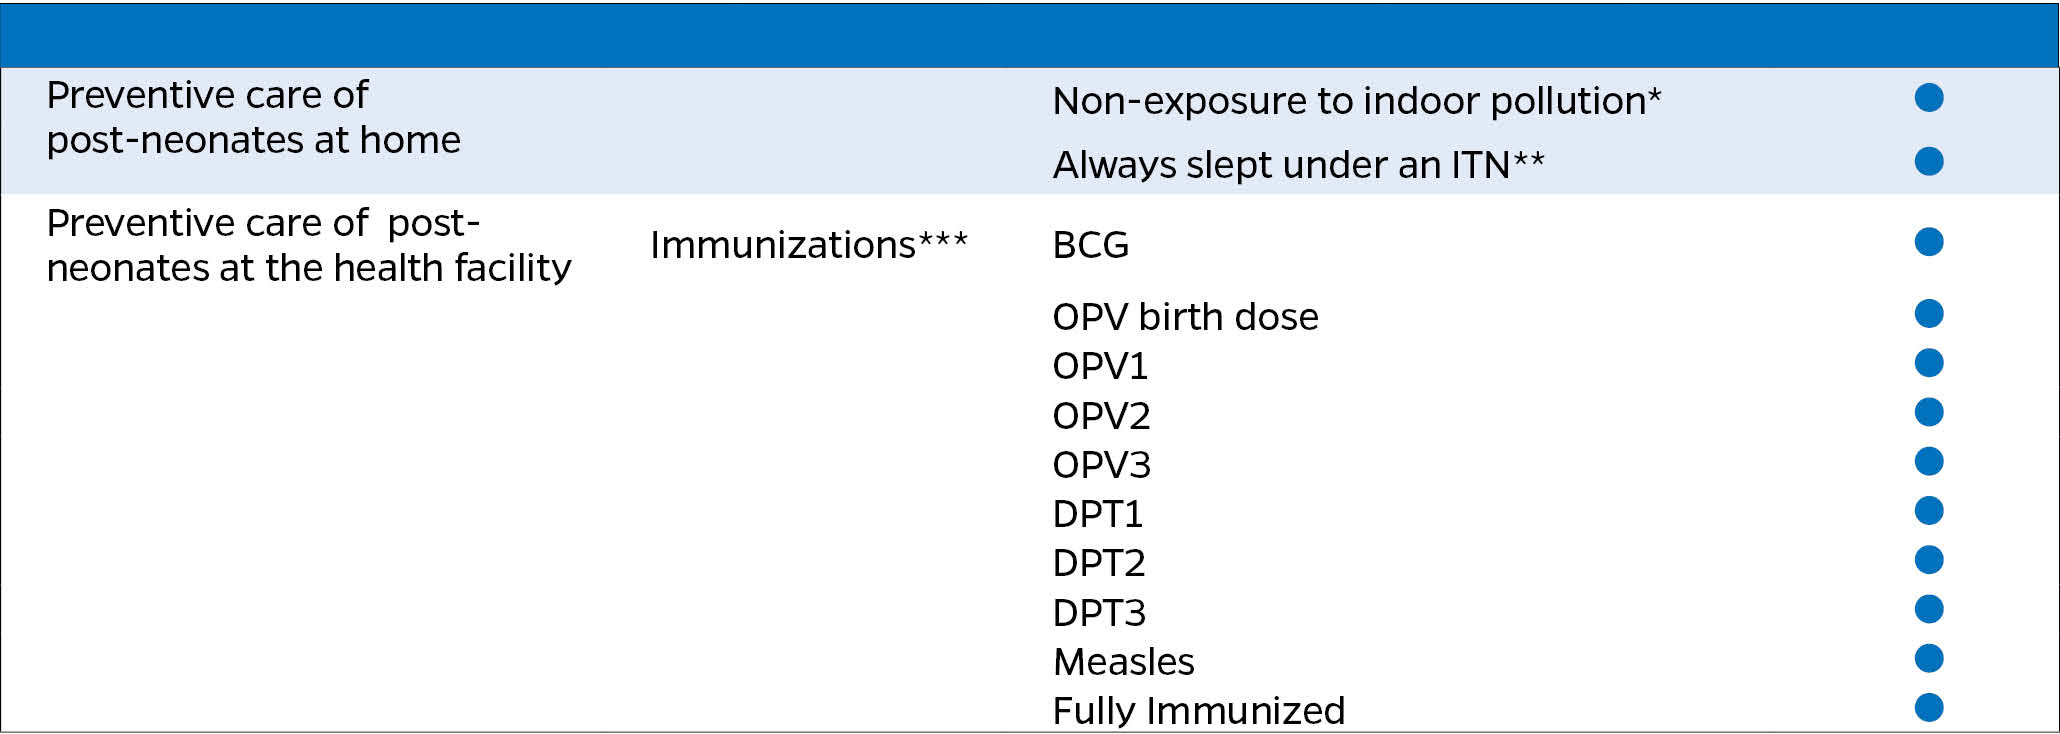
Content of Antenatal Care During the Pregnancy that Resulted in Stillbirths or Deceased Newborns
The components of antenatal care (ANC) received by mothers of stillbirths or deceased who completed at least one visit during their pregnancy can be assessed through five interventions as shown in the table below.
Table 3: Content of Antenatal Care During Pregnancy, Stillbirth, and Neonatal Deaths 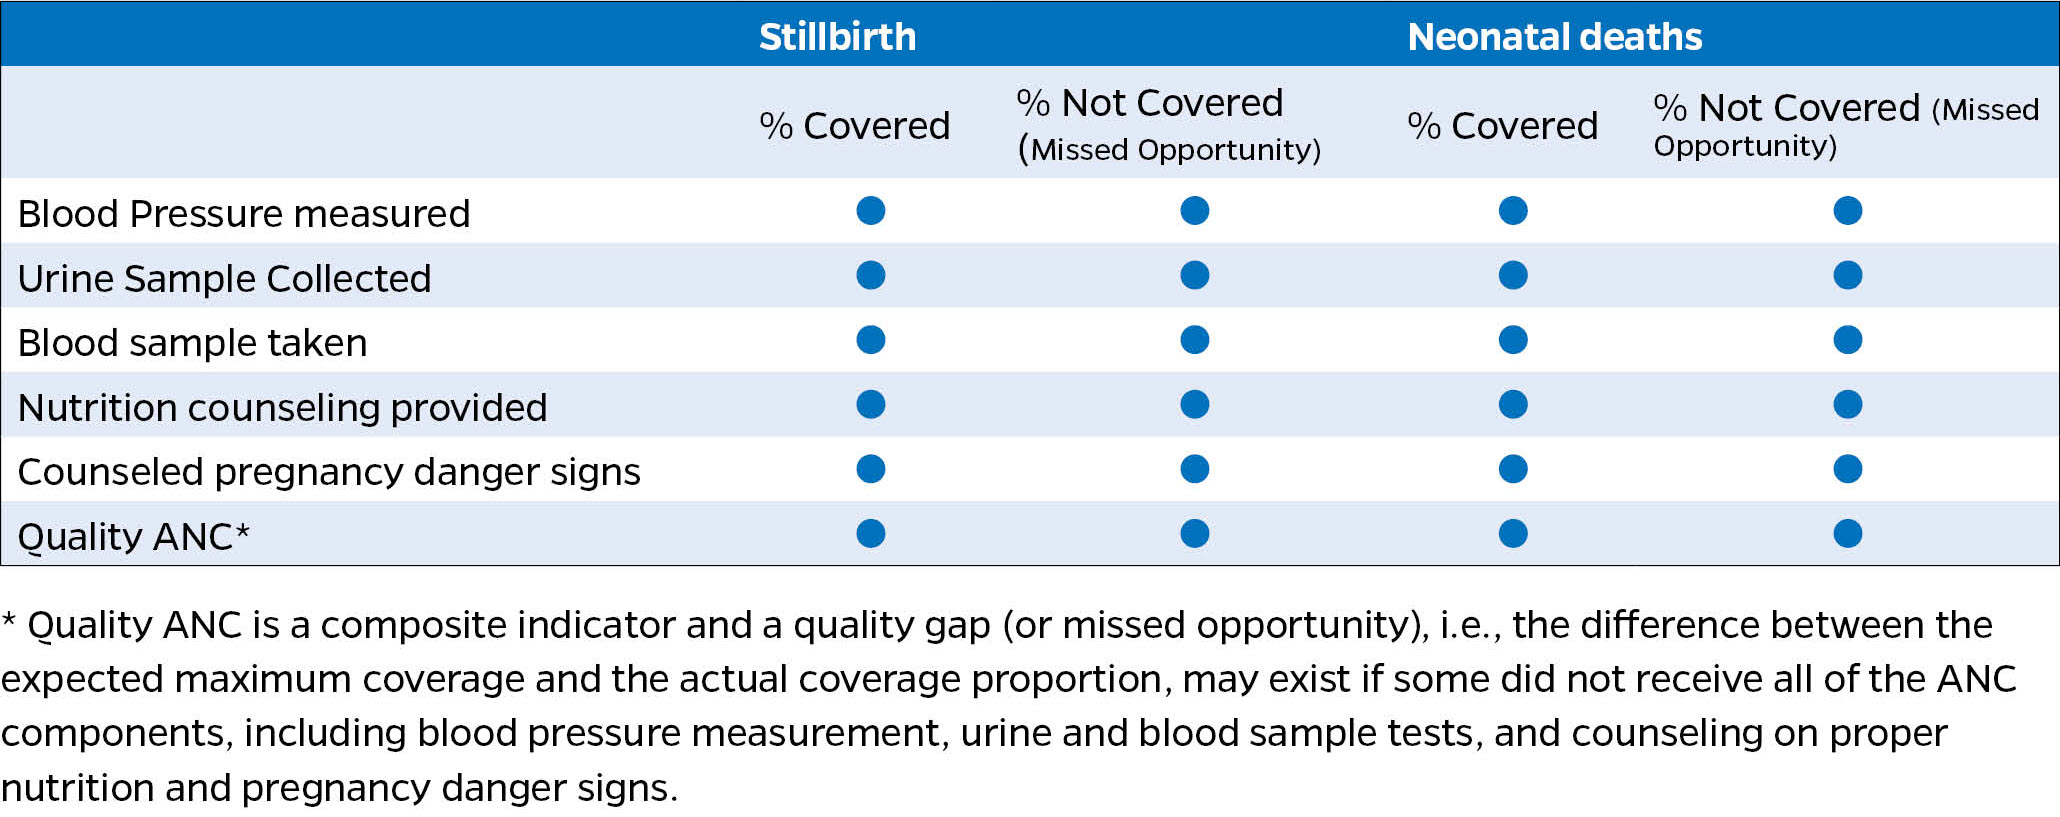
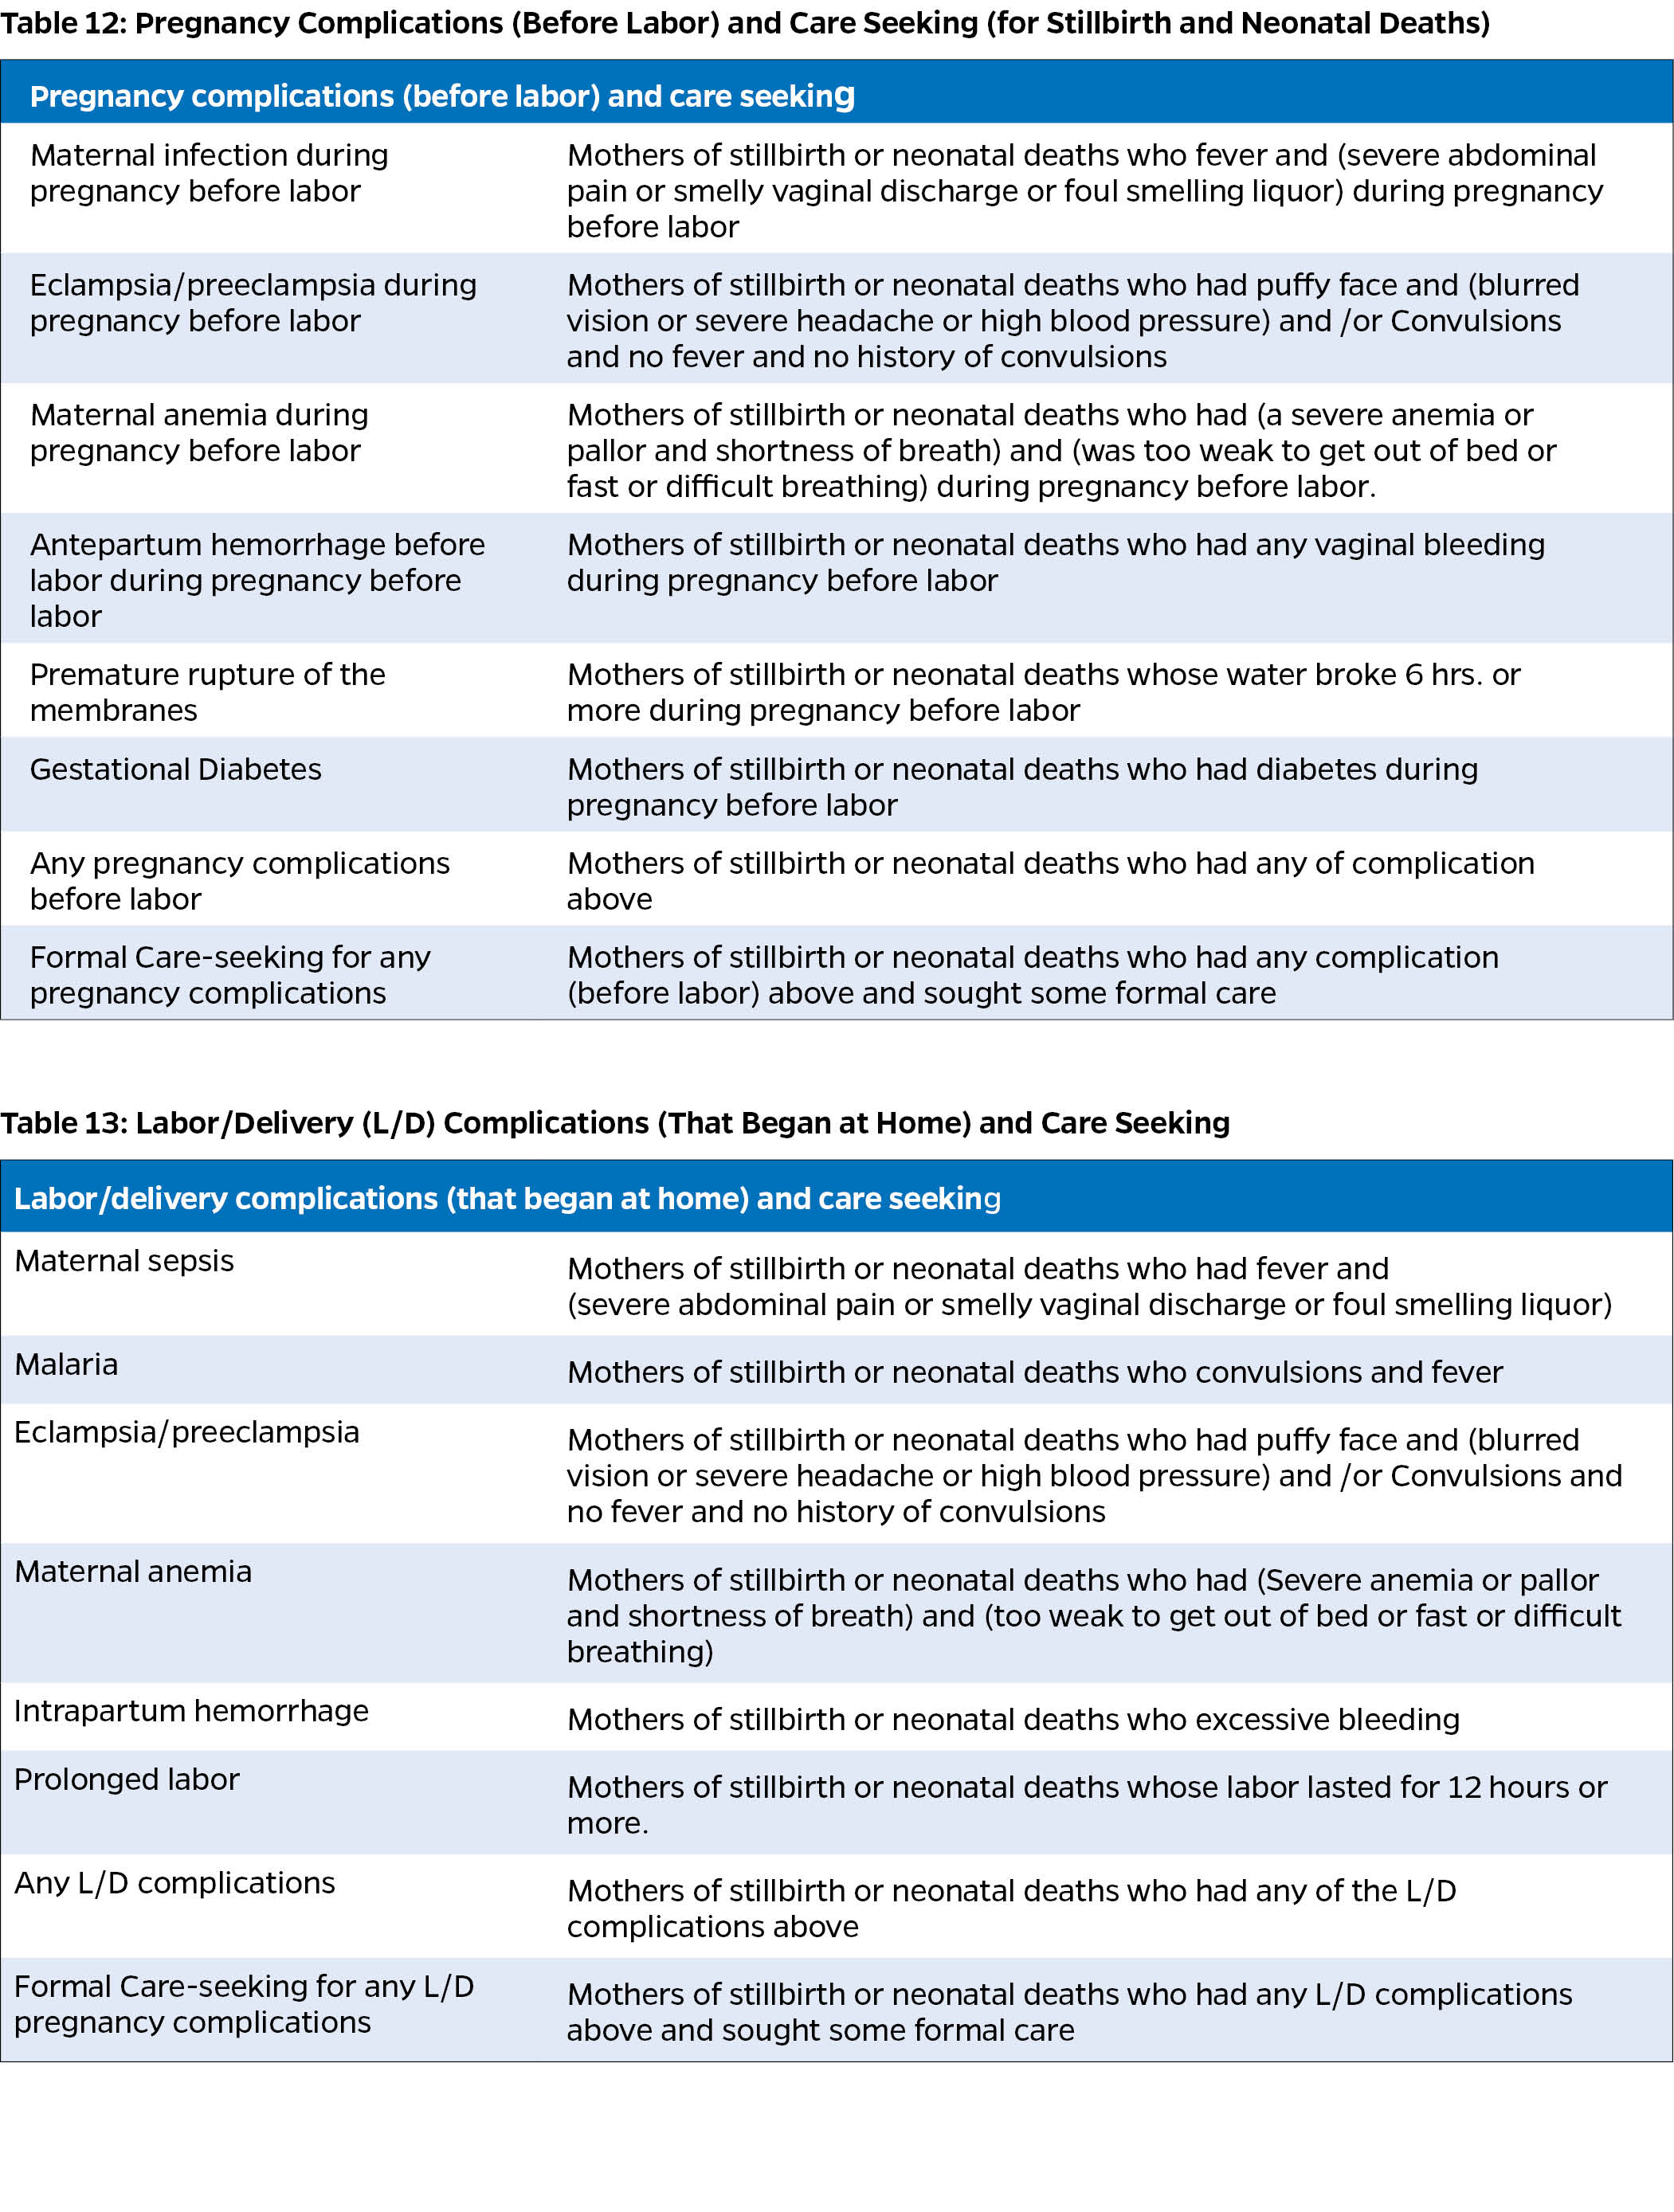
Other Key and Relevant Indicators
The COMSA/SIS-COVE data offer a unique opportunity to analyze maternal pregnancy and labor/delivery complications.
Dissemination
Regular dissemination of findings to relevant stakeholders and reporting SMSS data to international agencies such as the UN and WHO are critical components of an effective evidence-based decision-making framework. By adopting these practices, countries can enhance their health policy-making processes, ensure greater transparency, and contribute valuable data to the global health community.
Public Website
The public website serves to describe and promote the project and supporting agencies, describing the goals, the methods, and the people involved. Depending on the setting, it may be best to present the website in multiple languages.
Public Data Access
COMSA/SIS-COVE Public Website Example
comsamozambique.org
- Information about the data
- Public data acess
- Data visualizations
The project should also provide a mechanism for researchers and the public to access the data. This may be through the project website; typically, to get access to the datasets, a visitor must register and agree to the data use agreement. Then, they are immediately granted access to the downloads of population, events, and cause-of-death data. The data downloads are logged into the system. It is possible to create a data repository without a public brochure style site. Academic libraries offer this service, and there are software packages available to use as a starting point. One example is the NADA data archive: https://nada.ihsn.org/.
Communications Products
COMSA/SIS-COVE Example:
-Examples of communications products developed
The project should develop a strategic communications plan to ensure the learning generated by the project reaches the right audiences with the right messages through the right channels. A mix of both longer, technical documents and shorter materials for a general audience are essential to conveying information to a broad range of stakeholders. Effective use of data visualization is important to ensure that the data can be understood easily. Developing a standard color palette and branding and graph guidelines ensures that the documents look coherent.
To Learn More:
- UNdata.org glossary – A website providing information about calculating the birth and mortality rates described above.
- Peter Byass’s InterVA-5.1 User Guide
- WHO Strategic Communications: Framework for effective communication
- Publications list from COMSA/SIS-COVE website
- World Health Organization Verbal Autopsy resources
- InsilicoVA verbal autopsy algorithm
- InterVA verbal autopsy algorithm
- Expert Algorithm Verbal Autopsy (EAVA)
- Kalter et al. (2016) Validating hierarchical verbal autopsy expert algorithms in a large data set with known causes of death – Peer-reviewed journal article describing the performance of EAVA method
| Last updated |
|---|
| May 20, 2025 |
-
Kalter HD, Perin J, Black RE. Validating hierarchical verbal autopsy expert algorithms in a large data set with known causes of death. J Global Health, 2016;6(1). doi: 10.7189/jogh.06.010601 ↩
-
Serina P, Riley I, Stewart A, et al. Improving performance of the Tariff Method for assigning causes of death to verbal autopsies. BMC Med, 2015;13:291 DOI 10.1186/s12916-015-0527-9. ↩
-
Comparing verbal autopsy cause of death findings as determined by physician coding and probabilistic modelling: a public health analysis of 54 000 deaths in Africa and Asia. Byass P, Herbst K, Fottrell E, et al. J Glob Health, 2015;5(1). doi: 10.7189/jogh.05.010402. ↩
-
Probabilistic cause-of-death assignment using verbal autopsies. McCormick TH, Li ZR, Calvert C, et al. J Amer Stat Assoc, 2016/3/14. doi.org/10.1080/01621459.2016.1152191 ↩
-
Leitao J, Desia N, Aleksandrowicz L et. al. Comparison of physician-certified verbal autopsy with computer-coded verbal autopsy for cause of death assignment in hospitalized patients in low- and middle-income countries: systematic review. BMC Med 2014;12:22. http://www.biomedcentral.com/1741-7015/12/22. ↩
-
Brown P, Lyson M, Jenkins T. From diagnosis to social diagnosis. Soc Sci Med. 2011;73:939–43. doi: 10.1016/j.socscimed.2011.05.031 ↩
-
Waldman R, Campbel CC, Steketee RW. Overcoming remaining barriers: the pathway to survival (Current Issues in Child Survival Series). Arlington: The Basic Support for Institutionalizing Child Survival (BASICS) Project; 1996. Available: http://pdf.usaid.gov/pdf_docs/PNABZ644.pdf ↩
-
Waldman R, Campbel CC, Steketee RW. Overcoming remaining barriers: the pathway to survival (Current Issues in Child Survival Series). Arlington: The Basic Support for Institutionalizing Child Survival (BASICS) Project; 1996. Available: http://pdf.usaid.gov/pdf_docs/PNABZ644.pdf ↩
-
Requejo JH, Bryce J, Barros AJ, Berman P, Bhutta Z, Chopra M, et al. Countdown to 2015 and beyond: Fulfilling the health agenda for women and children. Lancet. 2015;385:466–76. doi: 10.1016/S0140-6736(14)60925-9. ↩
-
Waldman R, Campbel CC, Steketee RW. Overcoming remaining barriers: the pathway to survival (Current Issues in Child Survival Series). Arlington: The Basic Support for Institutionalizing Child Survival (BASICS) Project; 1996. Available: http://pdf.usaid.gov/pdf_docs/PNABZ644.pdf ↩
-
Kerber KJ, de Graft–Johnson JE, Bhutta ZA, Okong P, Starrs A, Lawn JE. Continuum of care for maternal, newborn, and child health: from slogan to service delivery. Lancet. 2007;370:1358–69. doi: 10.1016/S0140-6736(07)61578-5. ↩
-
Boschi-Pinto C, Young M, Black RE. The Child Health Epidemiology Reference Group reviews of the effectiveness of interventions to reduce maternal, neonatal and child mortality. Int J Epidemiol. 2010;39(suppl 1):i3–6. doi: 10.1093/ije/dyq018 ↩