Operational Reporting
Guide
This guide focuses on reporting related to Population, Events, and Verbal Autopsies (VA). These are reports intended to support supervision and data management as opposed to enabling analysis of SRS data. Reports largely focus on three types of data:
- Understanding your population
- SRS Events
- Verbal Autopsies
Defining the content and metrics to be put in these operational reports is not not the responsibility of the IT team; rather, the SRS program administrators and staff should define the reports and metrics based on how they would like to assess the program. However, there exist some commonly-used types of operational reports, and they are presented in this section to provide awareness and context to the IT teams about what they might need to track in the SRS systems.
Three types of data for operational reporting
Understanding your population
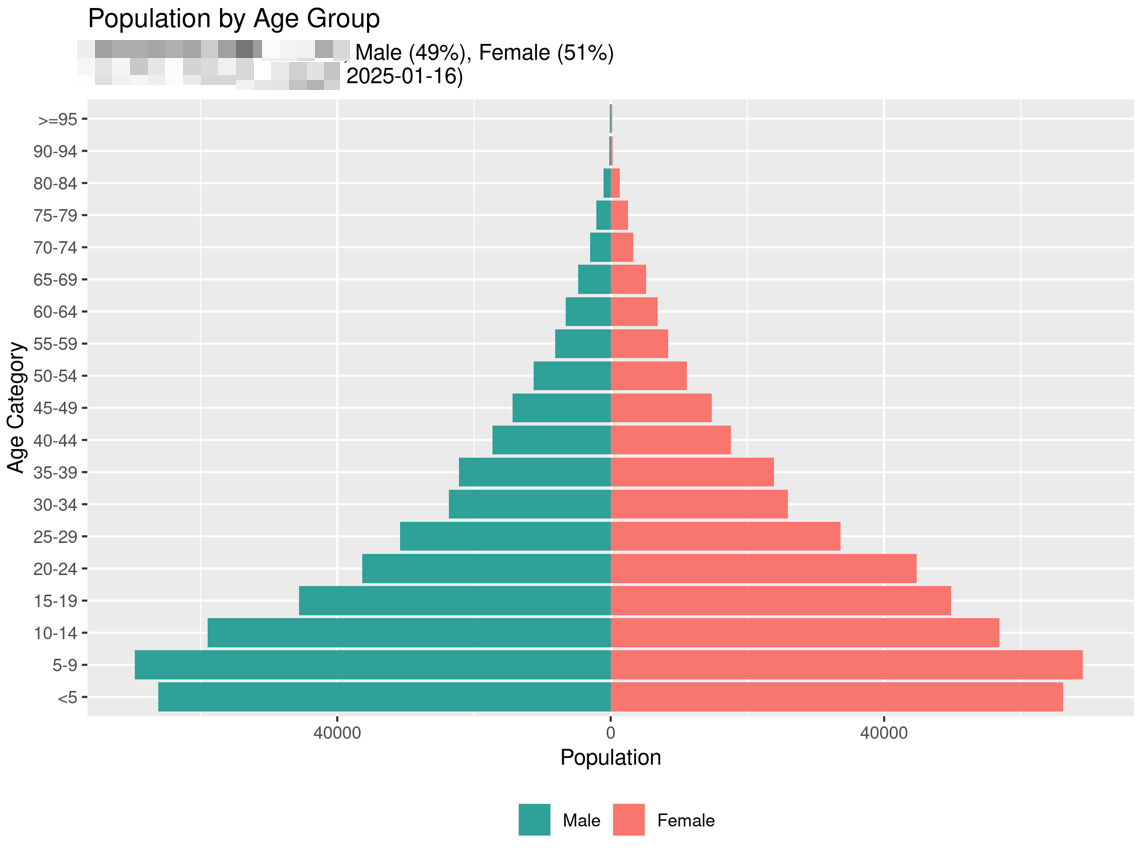
Demographics reports will help confirm that the sample population is representative, and interactive maps will prove the data collectors are working within cluster boundaries. Core reports show the total number of households and total number of people within those households. At the beginning of the project these numbers will grow as each cluster is added to the SRS. These reports will confirm clusters are appropriate size in terms of household and population count. Because of challenges in maintaining population data in real time. After initial census, it is recommended that this data is updated in a yearly or biennial cycle.
- Population by Age Group (pyramid)
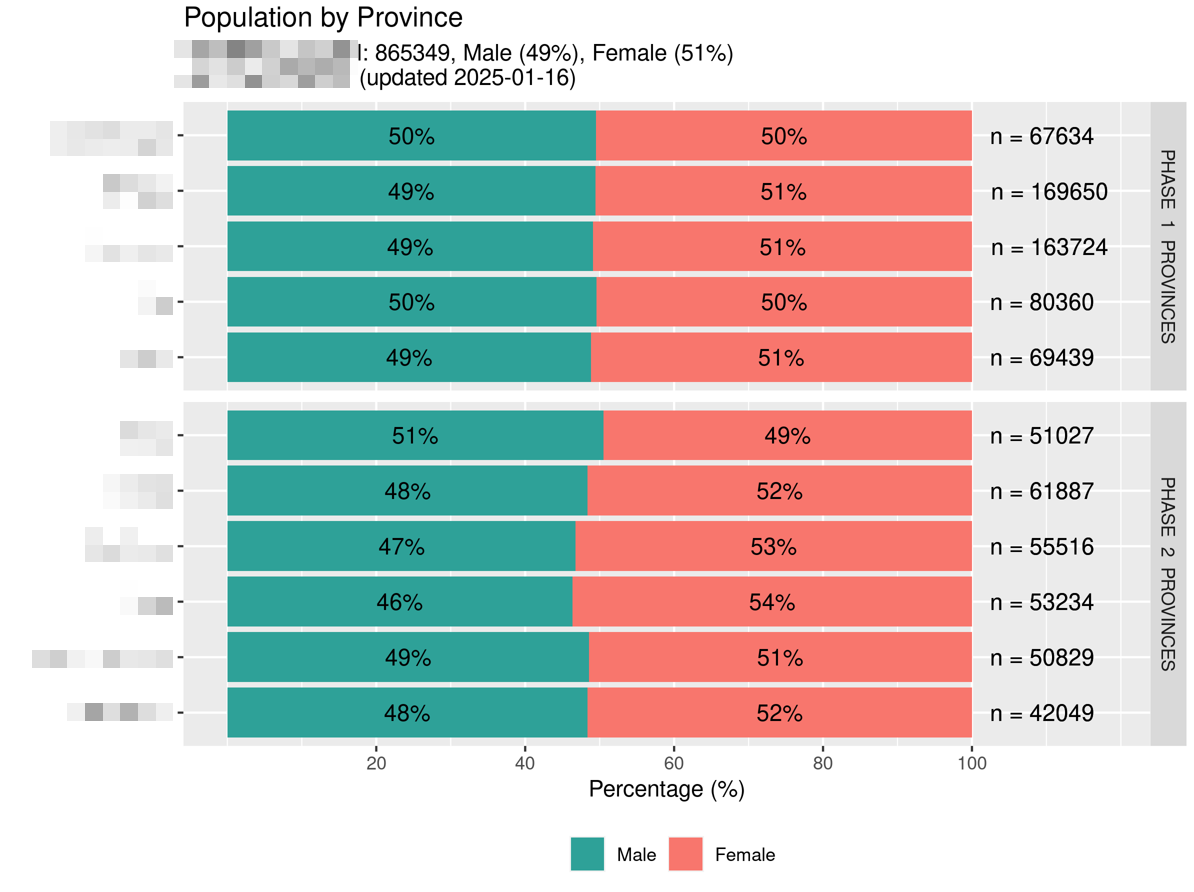
- Population by sub-national adminstrative boundary (e.g., province or region)
- Interactive mapping
- Show Cluster Boundaries and location of homes within cluster
- Zoom in to see geographic details, Zoom out for overview
- Understand physical challenges for Data Collection teams
- Show verified location of home data collection
Events
Operational reporting on events follows the theme of releasing data that can show where and when pregnancy, birth, and death events are being captured by SRS data collectors. Program leaders could use areas with no events as an indication of needing intervention, assuming that events should be occurring. Data on all event types can be stratified as follows, with cutoffs appropriate to your country’s expectations:
- Percentage of Data Collectors Reporting Events in the Last 3 Months
- Strata:
- 0: NO DATA: This is an important group. Any 0s would require urgent attention. It could be the data collector has quit or they are having difficulty with their electronic device.
- 1-4: UNDERPERFORMING: This group should be investigated to find out what the problems are.
- 5+: ADEQUATE: This groups is recording the minimum expected number of events.
- The Underperforming and Adequate cutoff (5) should be adjusted to fit expectations within the country context.
- Average time from event to data collection and from data collection to submission to server (in days)
Verbal Autopsies
The goal of operational reporting for VAs is focused interviews scheduled and completed, as opposed to the quality or conclusions from the VAs (which is covered under Data Science). Metrics to track that can provide a glimpse into the VAs conducted from an operational perspective include:
- Average time from death event to verbal autopsy collection
- Deaths collected over 3 month period (quarterly)
- Show percentage still not collected (reason: family not found, family still grieving, forgot to go
- VA interviewer performance
- by data collector
- Strata
- Completed (with COD data)
- Refused
- In progress
- Completed (no COD data)
Two levels of reporting
Furthermore, reports on all of these types of data can be used at two supervisory levels:
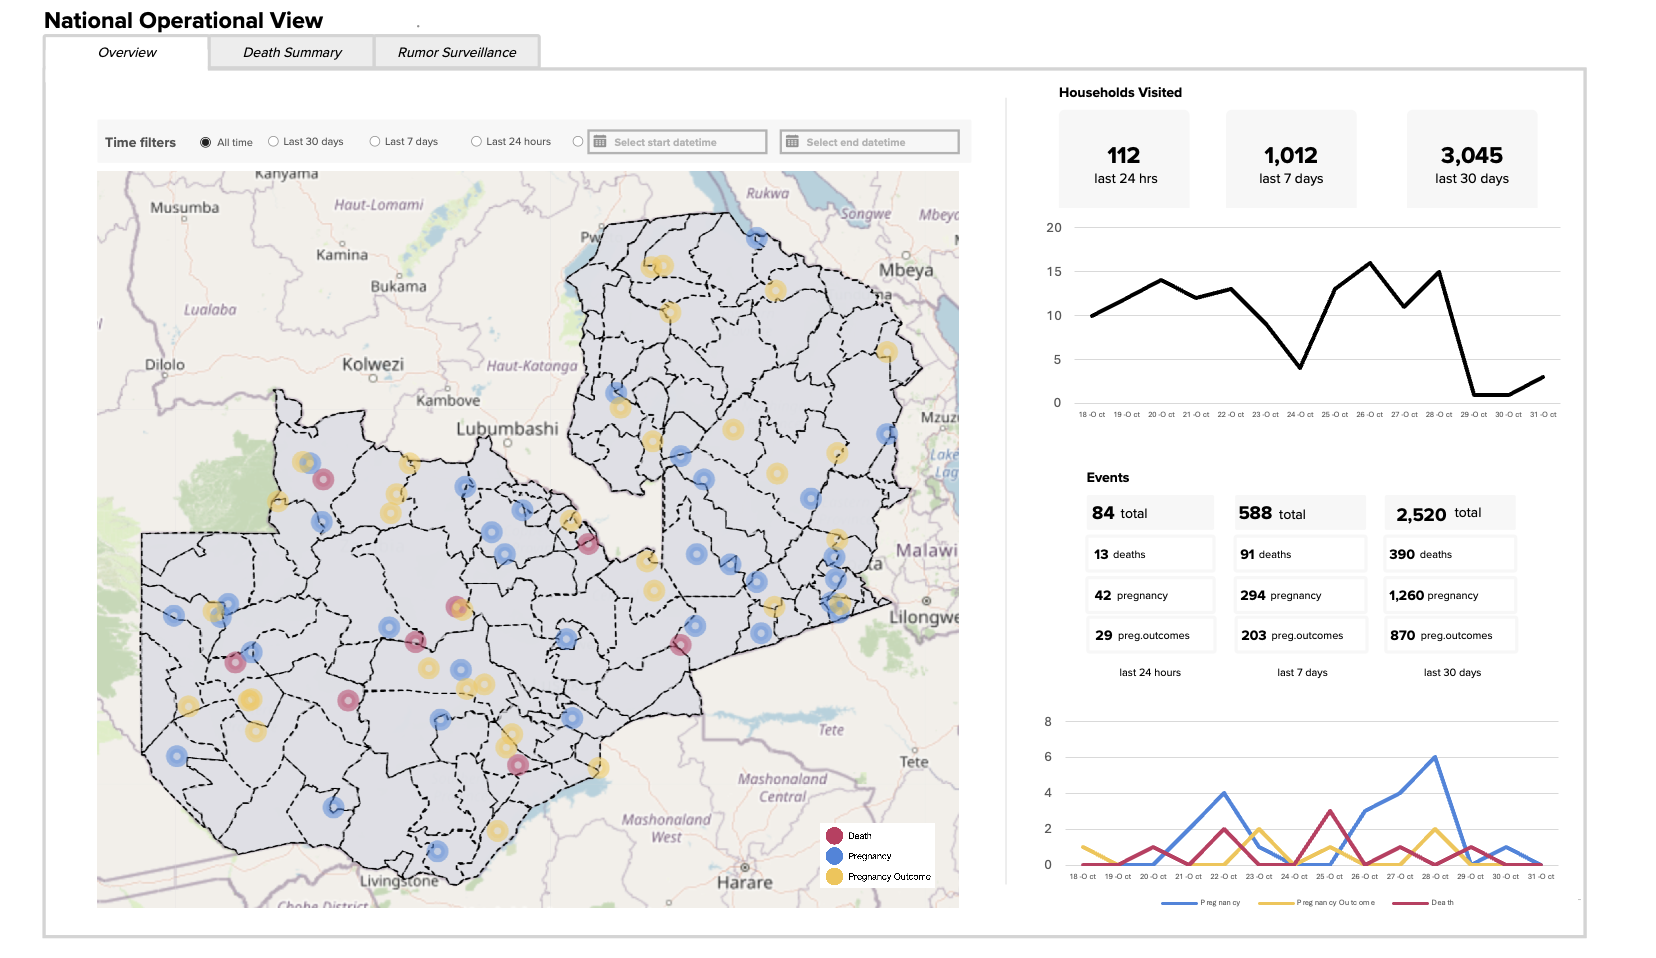
- Reports focused at the national level are aimed at the project director and the core management team overseeing the entire SRS. Most national-level reports are segmented by province or another sub-national administrative boundary.
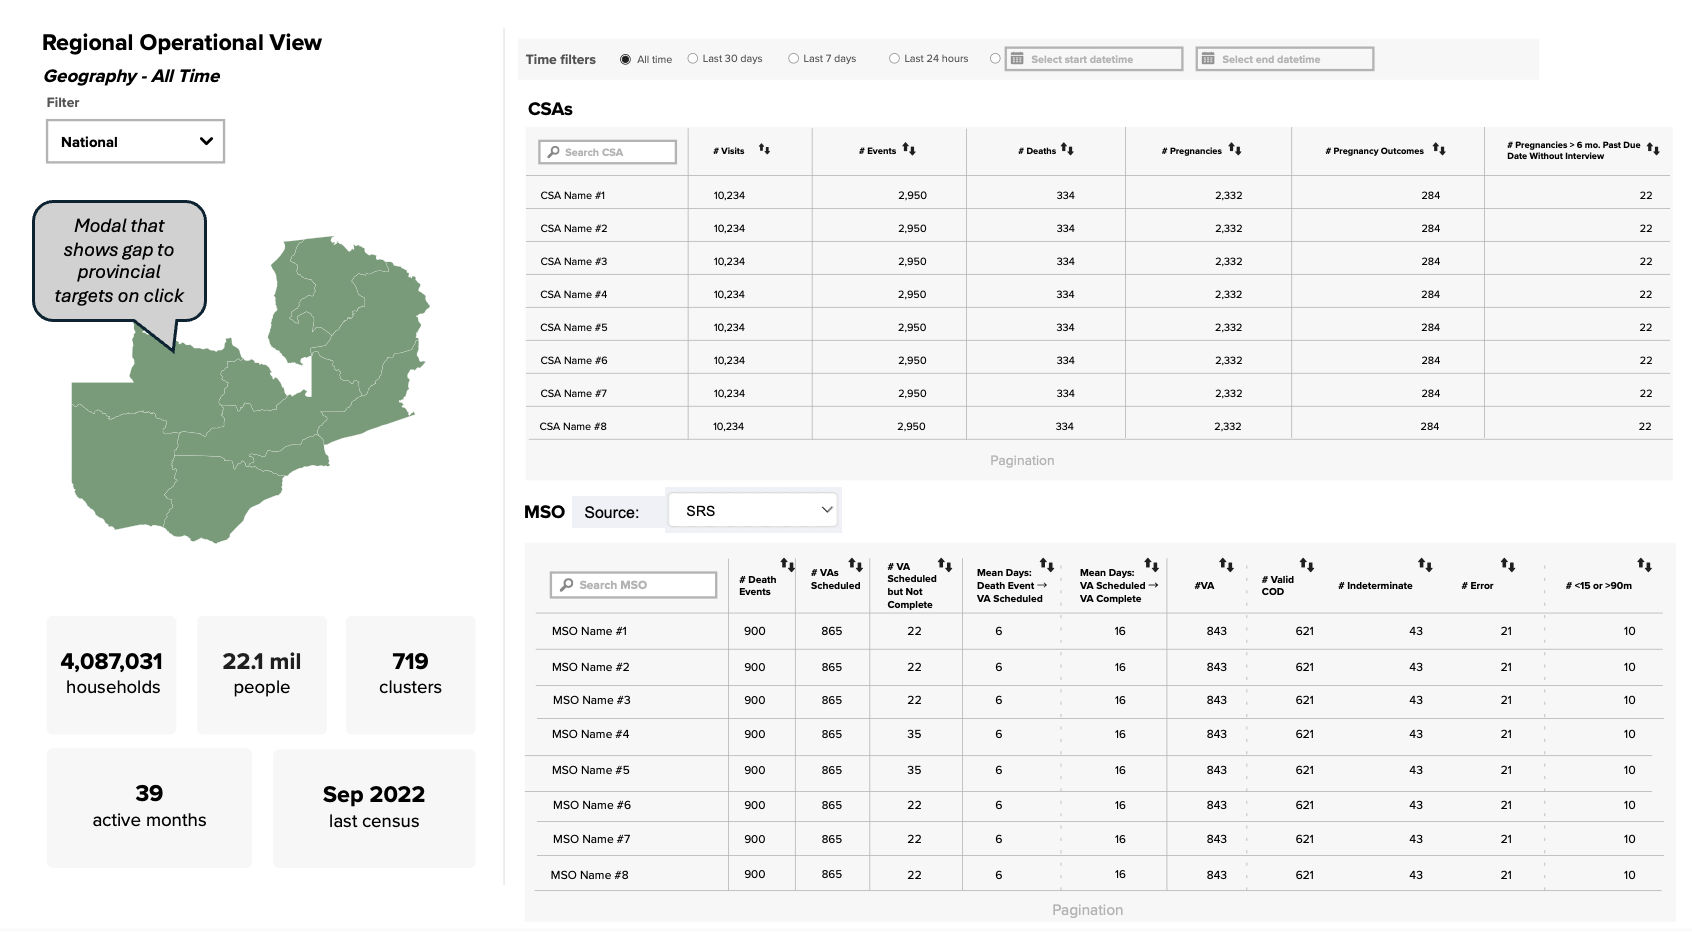
- Reports focused at the regional level are aimed at day-to-day operational reports on metrics to enable and field staff to oversee individual clusters and data collectors. Most regional-level reports are segmented by cluster.
While the national and regional level reports focus on the same types of data, they often have the information presented in different ways. For example, metrics on specific data collectors, such as individual line-level fieldworker performance, is typically only useful for a regional field supervisor. National level stakeholders may care more about average fieldworker performance to understand the program at large. This distinction should be determined in conjunction with your SRS design team. The Zambia story, below, illustrates the possible differences between national and regional reports.
Tools
The following tools represent example visualizations for operational reporting taken from Mozambique’s SRS. For the tools and examples shared below, the clusters have ~1200 people and ~300 households. Your country’s cluster size will vary based on the sampling frame and SRS design.
Understanding your population
Population by Age Group (pyramid)
Population by Province
Interactive Maps 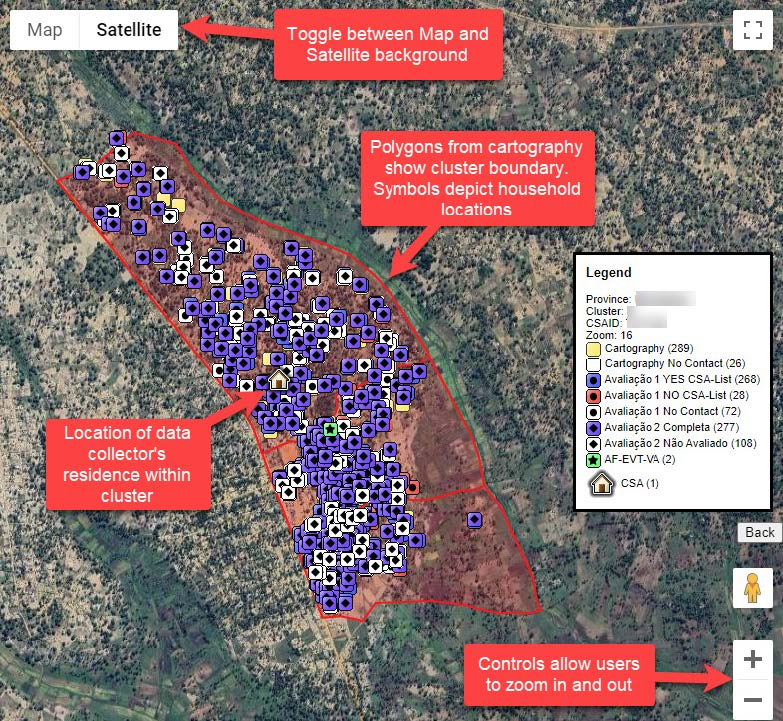
Events
Cluster activity by number of events in last 3 months (National shown, segmented by province)
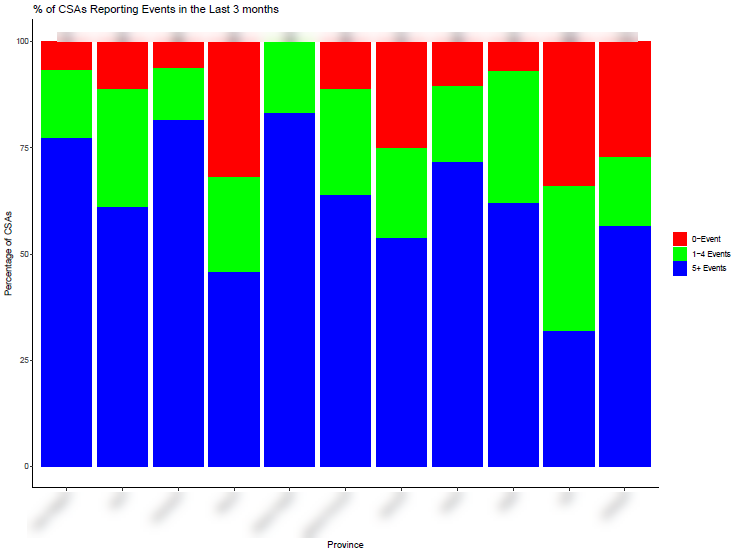
In this example, all vital events are combined (Pregnancies, Births, Deaths). These could be broken out by event type into separate graphs for a more nuanced understanding.
Steps for processing data:
- Raw data from ODK
- Basic cleaning = duplicates removed, known errors corrected
- Sum events by cluster
- Filter for selected time period – last 3 complete calendar months
- Add rows for clusters with 0 events
- Group by event count categories (0, 1-4, 5+)
- Sum counts by province
- Convert to percentages
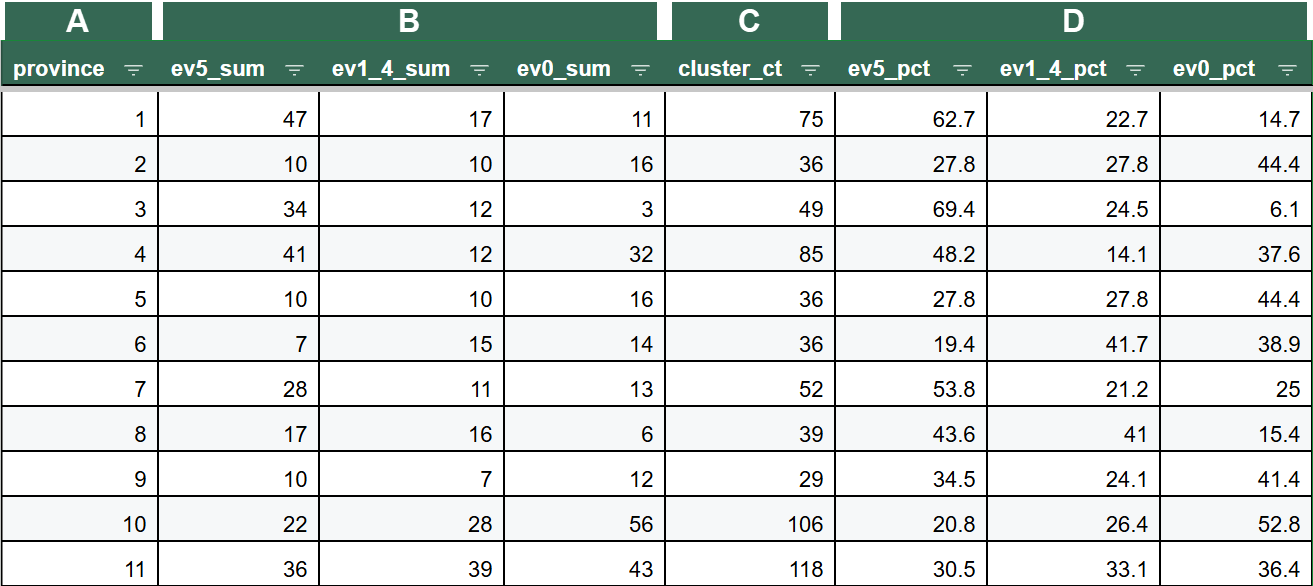
| Item | Description |
|---|---|
| A | Province Name/ID |
| B | Count of clusters reporting 5+, 1-4, or 0 events in last 3 months |
| C | Count of clusters within province |
| D | Percentage of clusters reporting 5+, 1-4, or 0 events in last 3 months |
Average time from event to data collection
- Row: Represents cluster
- Order ascending by: Sub-national administrative boundary and cluster ID
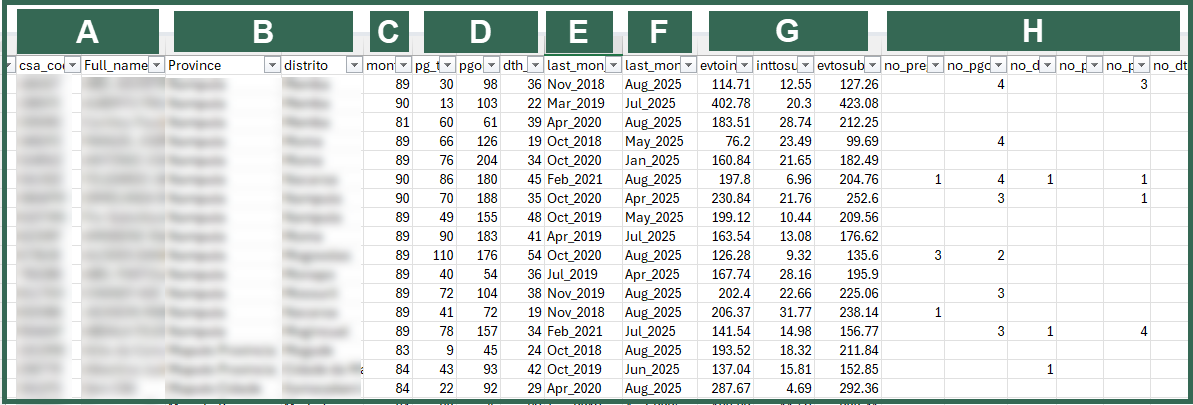
| Item | Description |
|---|---|
| A | Cluster ID and Data collector name |
| B | Geographic Location: Sub-National Administrative Boundary (Province) and District |
| C | Total Months the cluster has been active |
| D | Total event counts:
|
| E | Last month and year of Household Census (Last time a new household was added to cluster.) |
| F | Last month and year of any event collected |
| G | Average elapsed time in days
|
| H | Monthly Event Counts: Count per event type for Every month/year of the project. Example:
Repeat for each month / year combination. |
Verbal Autopsy
TODO: graphic and data for each Average time from death event to verbal autopsy collection
VA interviewer performance
Software
None
Stories
Zambia
Designing Operational Dashboards
To design the operational reports that Zambia’s NPHI wanted to include in their SRS system, the team used the examples provided here as a starting point to explore the types of information that should be available to national administrators as well as regional supervisors. They determined that the national dashboard should allow SRS program stakeholders to understand how the SRS is performing as a whole, desiring aggregated metrics on number of events and visit time. In contrast, they desired that the regional dashboard be focused on data collector and mortality surveillance officer performance, allowing field supervisors the ability to understand which specific field staff might be falling behind targets. With those goals in mind, the team asked both stakeholders which metrics—and which specific visualizations—would be most useful to achieve these goals, developing the below set of dashboard wireframes. Following discussion and refinement, these dashboards are being built into the SRS software system.
| Last updated |
|---|
| Feb 28, 2026 |