Digital solutions and Information Technology Architecture
Step 6
Choosing appropriate hardware and software is crucial for ensuring that the system functions effectively. This section describes the information technology tools that were developed along with the decision-making factors for the Mozambique COMSA/SIS-COVE information systems. We describe how unique identifiers were generated and other key decisions that were made. Given the rapidly progressing update and innovations in digital solutions, a careful review of the state of the art is always necessary for the choice of an appropriate digital and information technology architecture. Future readers may find that the tools selected for COMSA/SIS-COVE in 2018 are no longer the best option.
Tech Tip: IT Handbook
Software developers and IT teams start here:
IT Handbook
General Guidelines
With rapidly improving digital technology for data collection, analysis, and dissemination, a SMSS must incorporate state of the art technology to ensure rapid data collection and transfer, real-time access and monitoring, analysis and release. This will require involving from the outset IT technicians and engineers. The choice of hardware and software must be guided by the context, the available capacity, and the overall objectives of the SMSS.
To provide concrete examples of what such a system looks like, we describe the COMSA/SIS-COVE system and choices of various equipment. In general, the COMSA/SIS-COVE technology system is organized in two main components:
- A set of hardware and software for data collection, transfer and storage, linked to a web-based dashboard for data monitoring
- A data analysis web-portal linked to the dashboard, and a public website.
Critical factors in decision-making related to hardware and software are:
Meeting the basic requirements in these areas: offline systems, capture of longitudinal data, and multilingual display, ease of use by community-based staff, broad requirements related to accessibility, adaptability, scalability, and security.
Cost
Reliability and maturity
Alignment with team member skills and experience
Table 5: Computer Hardware for the COMSA/SIS-COVE Project at Start of Data Collection. (2017-2019) 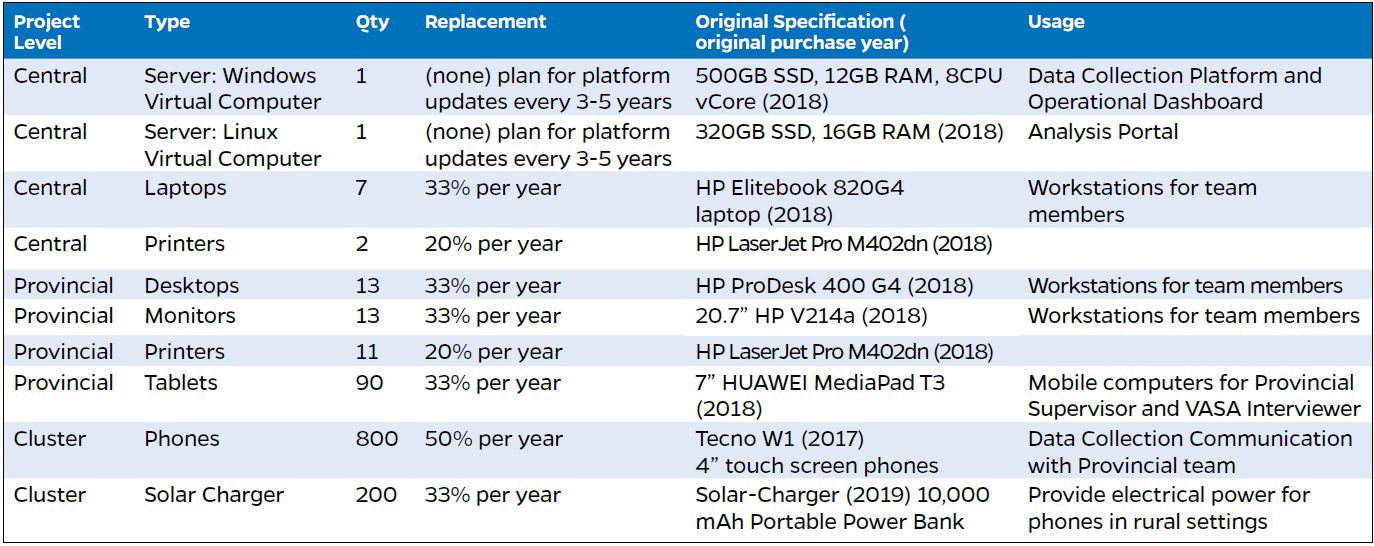
Table 6: Software for the COMSA/SIS-COVE Project 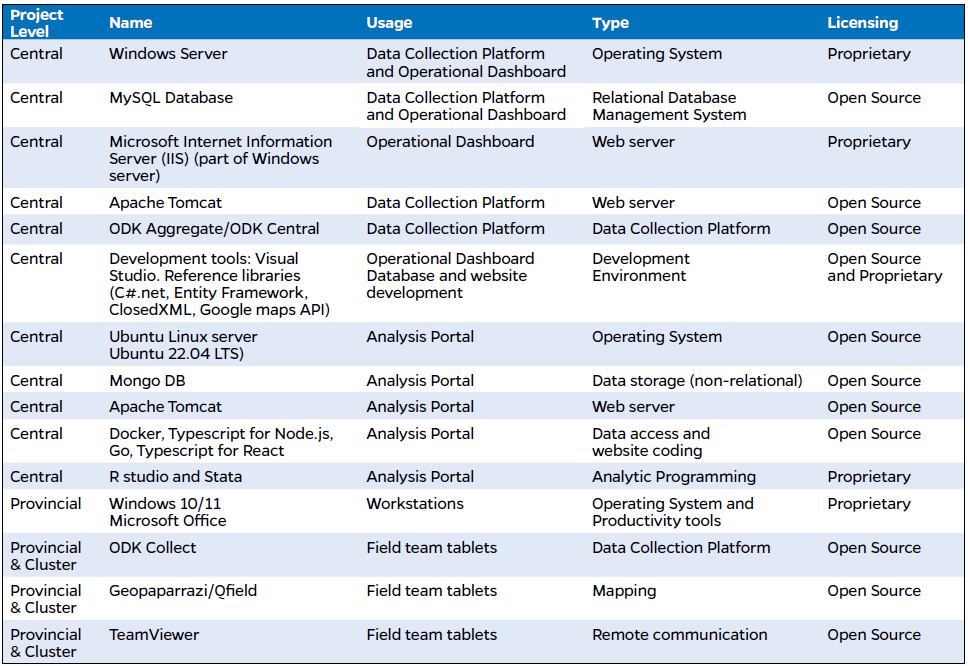
Digital Solutions at the Central Level
The Central data team is tasked with planning, implementing, and overseeing all data management needs of the system based on the decision-making factors listed above. For example, a cloud server may provide more reliability and better remote access compared to a locally hosted machine.
For Mozambique SIS-COVE, data collection and management used a Windows server hosted on a cloud platform. This single windows server hosted a Tomcat web server for the ODK Aggregate site, an IIS server for the custom ASP.NET website as an operational dashboard, and a MySQL server for database needs.
Operational Dashboard
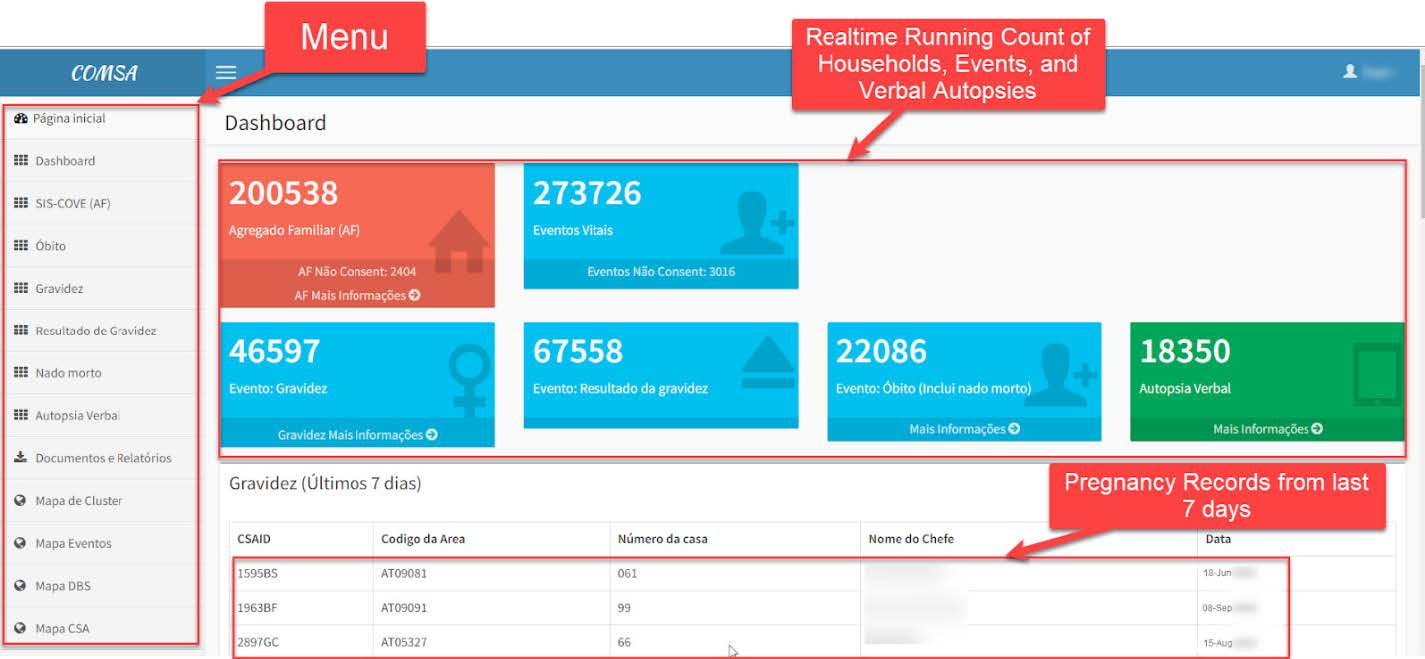
A web-based Operational Dashboard was created to display real-time activity and to enable the Central and Provincial staff to manage data collection activities. Provincial staff were restricted to managing data in their assigned province whereas Central staff work with data from the whole country. Team members can see running totals of all data collected over selected time periods. They can drill down to see details of individual forms and can generate reports for printing or sharing outside the system.
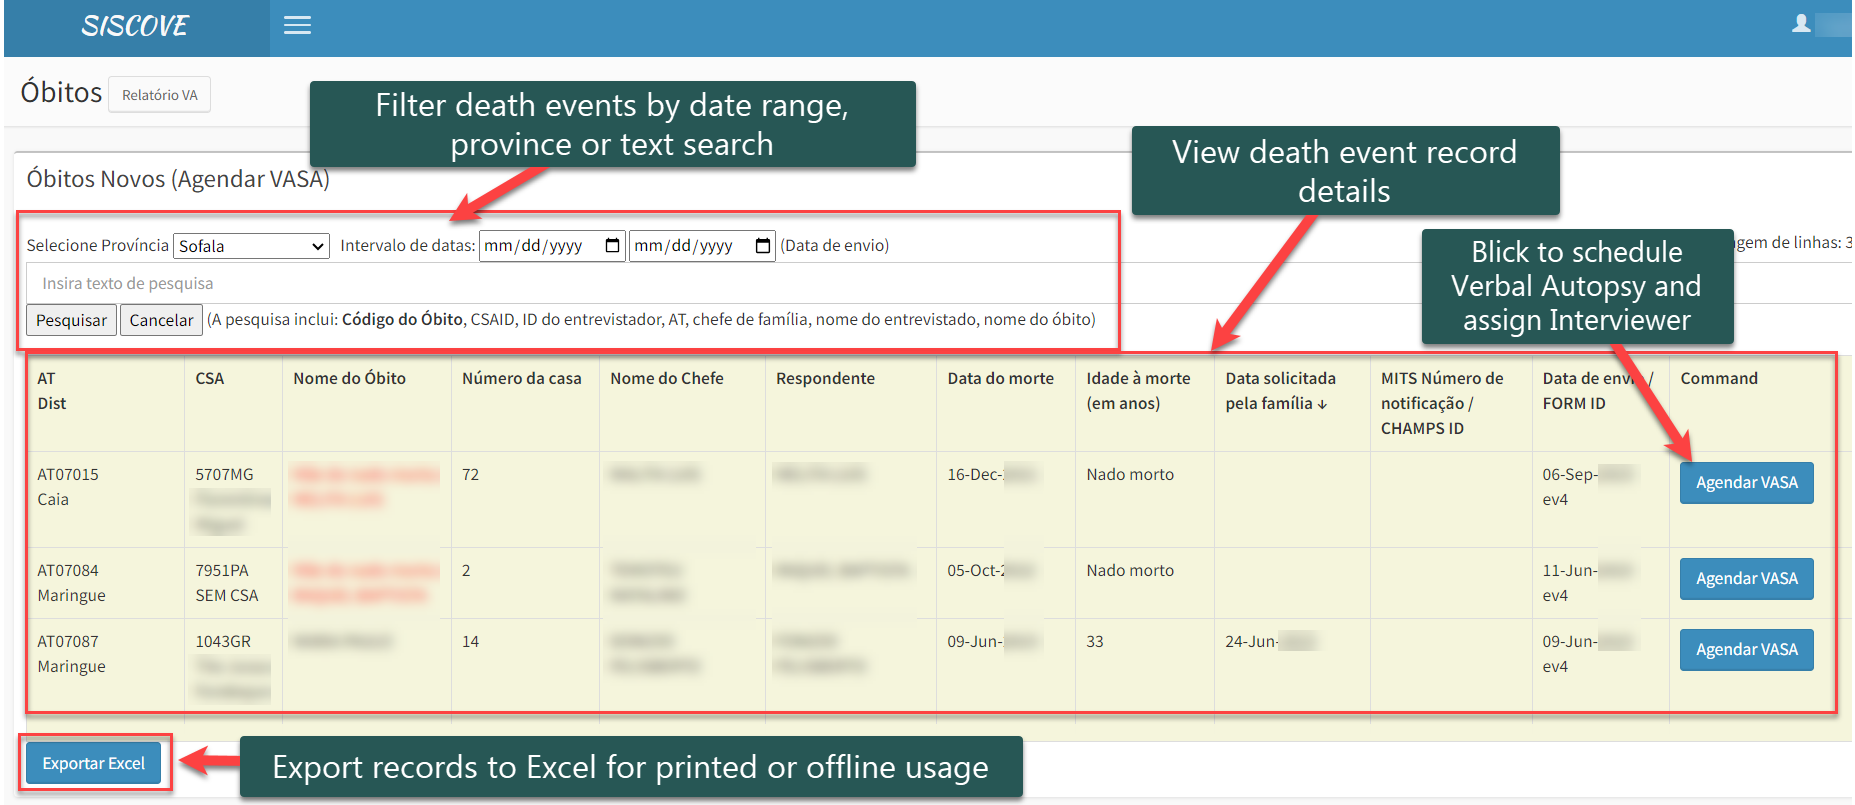
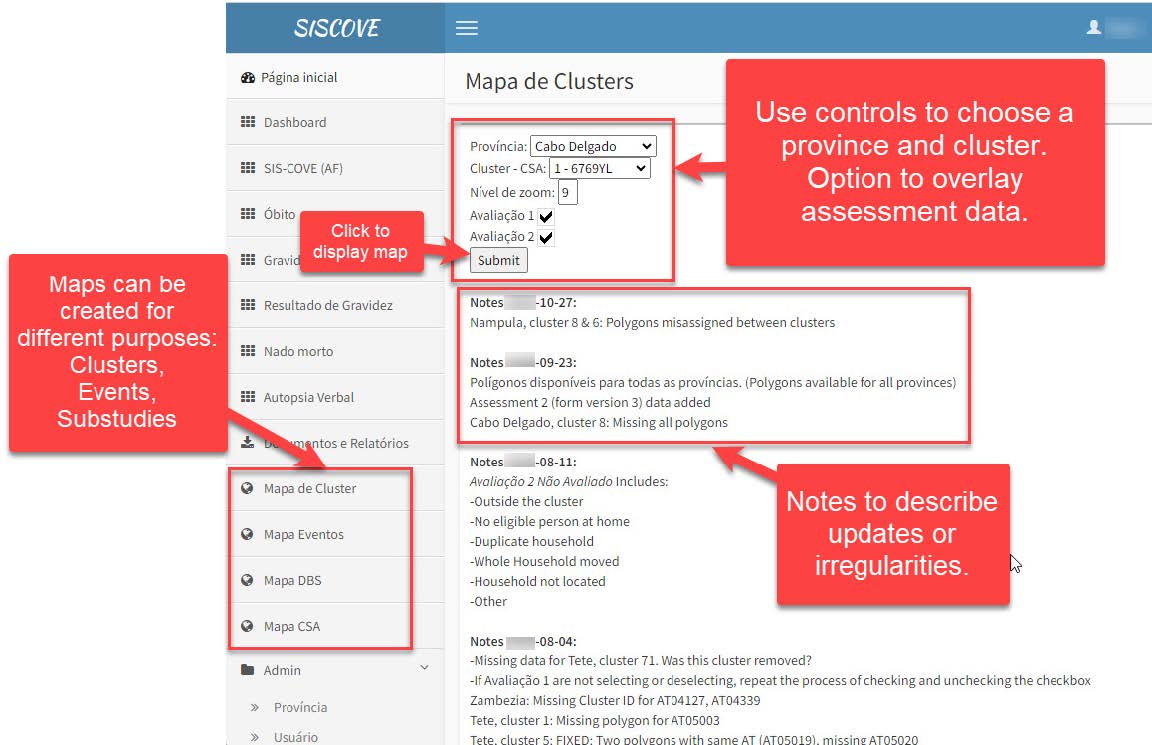
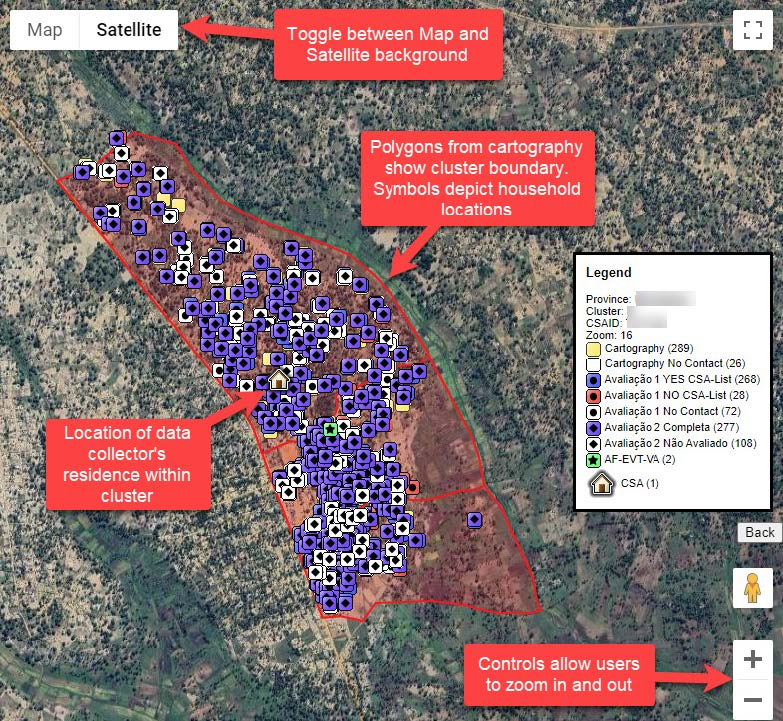
The site has a special feature for tracking participant deaths and assigning Verbal Autopsy interviewers to collect detailed information related to cause of death. Over the course of the project, an interactive mapping feature was expanded and became a more prominent tool.
-
COMSA/SIS-COVE Operational Dashboard (Supervisor or Central Team View) Examples from Mozambique SIS-COVE
-
COMSA/SIS-COVE Operational Dashboard (Death Management Page)
-
COMSA/SIS-COVE Operational Dashboard (Map Page I: Province and Cluster Selection)
-
COMSA/SIS-COVE Operational Dashboard (Dashboard Map Page View II: Interactive Cluster Map)
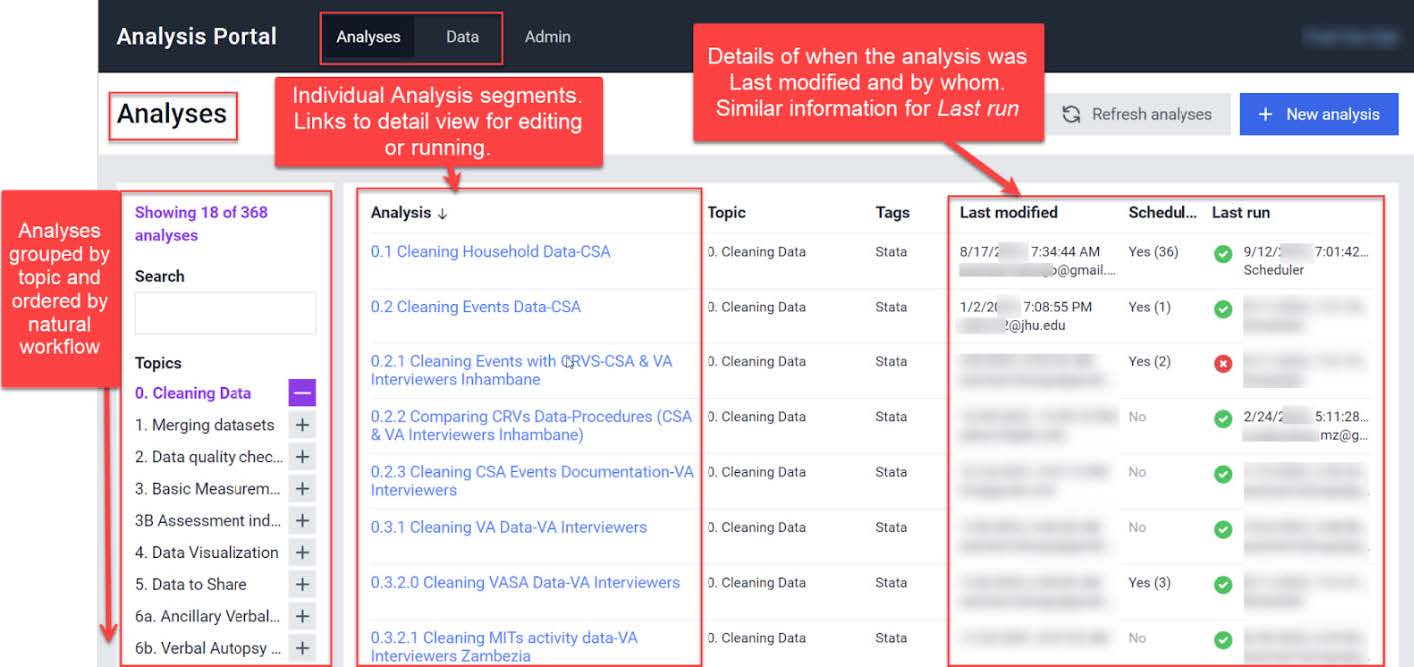
Analysis Portal
A collaborative monitoring and analysis server (Analysis Portal or just Portal) was created to host analytic datasets and codes, and to allow data analysis collaboration for the project team. The Portal uses a Linux Cloud Server and a custom web platform including React, Docker, Linux, Stata, R software. The Portal site has a copy of the master data. Any changes to the data on Portal do not affect the ODK Aggregate data or the Operational Dashboard.
The Analysis Portal has a data pool with two types of data. First, there is the data collection data from the ODK Aggregate platform. This data is automatically copied from the data collection server to the Portal every night in the form of text-based files. Second, the Portal has supplemental, or reference data, that can be uploaded manually.
The Analysis Portal has a page dedicated to analysis where scripts can be sequentially and automatically run on the data. In general, the cleaning, merging, and quality check scripts are scheduled to run after the daily data synchronization. This provides daily updates for teams monitoring the data and allows real-time analytic collaboration across multiple continents.
- COMSA/SIS-COVE Analysis Portal: Shared repository of Data and Linked Analytic Scripts (R and STATA)
Development Timeline
When using cloud-based hardware, servers can be initiated and provisioned within a very short time period. Configuration and software installation can generally be completed in less than one day. The major software development tasks require more time. The 3 major areas of development in the COMSA/SIS-COVE project were
- Creation of the electronic forms
- Development of the operational dashboard
- Development of the Analytic Portal.
In COMSA/SIS-COVE, three different team members lead these efforts.
Initial versions were created for testing and piloting. The piloting and testing versions were improved for the project Phase I start in five provinces, and were again improved for the Phase II start in the remaining six provinces. In the last 5 years, regular updates and features have been added in each area.
Table 8: Steps in the Development of COMSA/SIS-COVE’s Digital Technology 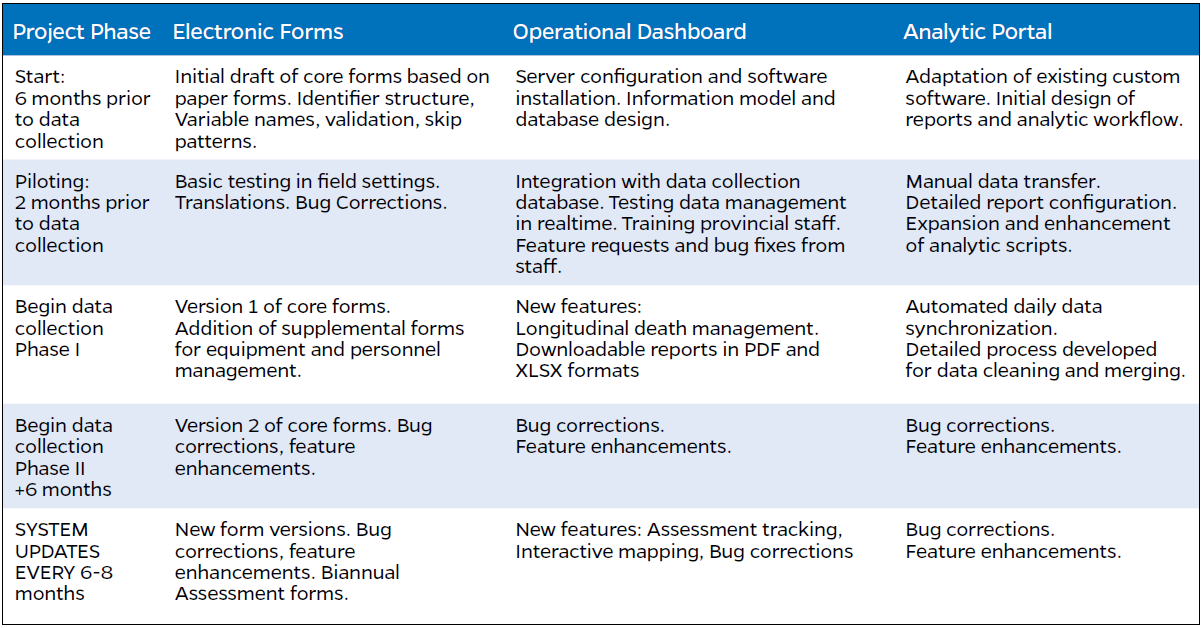
The central data team was originally tasked with supporting the community-based data collectors, but in practice, much of this work was delegated to the provincial team members. It was not practical for the two central data team members to visit, support, and manage all 700 community workers countrywide. Data team members played a central role in all initial trainings of community workers in each province. After startup, the data team shifted into a role of assisting provincial teams in providing support to community workers.
A public website was set up to present the system, data visualizations, tools and other resources as well as share data that are collected. The public website was set up a WordPress server and is managed by the study team.
Digital Solutions at the Provincial Level
Provincial team members are tasked with recruiting, training, and supervising data collectors, monitoring community-based data collection, conducting VASA interviews, and serving as a conduit of communication between the central and community levels. Provincial teams need access to the data collection server, dashboard, and analysis portal to monitor and supervise data collection. The Dashboard also provides tools to schedule, manage, and collect VASA interviews following each reported community death.
In COMSA/SIS-COVE, provincial supervisors and VASA interviewers were provided with shared laptop and printers. The laptops were used in the office to supervise data collection and communicate with the central team.
Each team member was provided with an 8-inch Android tablet computer with cellphone data connectivity. These tablets served as the core hardware used by the provincial teams.
Mobile devices have additional requirements. Some of these are related to general usability and some are related to data collection application requirements, such as:
- Device screen size
- Battery capacity
- Durability
- RAM
- CPU
- GSM compatibility
- Android OS level
- Availability in country
Provincial teams used the dashboard to schedule and manage VASA interviews for each death. After VASA interviews were assigned to interviewers, the dashboard allowed schedules to be downloaded in an Excel format for team usage and printing. In the field, tablets were the main devices used by interviewers for the VASA interviews. In sites with internet connectivity, they provided access to the central servers for monitoring CSA data collection. Additionally, the tablets provided important study management functions. They could be used as a hotspot for remote CSA data connectivity in cases where the CSA did not have internet connection. The devices served as conduits for project communication using email, SMS, WhatsApp, and phone calls. The devices were also used to support GPS mapping of households and cluster boundaries.
The main software packages used by the tablets are ODK client software (ODK Collect) and the Chrome browser to connect to the Dashboard and the Portal. In addition, the tablets used office type software for documents and spreadsheets; and Geopapparazi, Q-Field, and Google maps for GPS work.
The provincial team is also tasked with registering SIM cards for each device user, assigning devices to community-based data collectors, and monitoring and replenishing cellular and internet access on the devices.
Technology needs at the Community Level
It is important to provide community data collectors with reliable equipment, logical well-designed forms, and secondary systems that can serve as a backup when critical infrastructure is not available. In choosing phones for community-based data collectors, it is important to balance cost, available features, reliability, and availability. In COMSA/SIS-COVE, community workers were provided with 4-inch Android cellphones.
During cluster enumeration, the phones were used to map households and cluster boundaries. During routine surveillance, the phones were used to collect vital event data; pregnancies, pregnancy outcomes, and deaths. The CSAs relied on the ODK Collect application to provide forms and submit data to the central server. They also used Geopapparazi and google maps as GPS tools to identify cluster boundaries and mark household locations. The cell phones also provided a means for communication with the provincial supervisory team via WhatsApp, SMS, and cell phone calls.
When calculating the quantity of devices, it’s important to add a percentage to make-up for loss and damage. In the field, with heavy usage, phones can be expected to wear out quickly, so there must be a plan for cyclical replacement. Although wear and tear depend on the quality of device and environmental conditions, expect to replace devices every 2-3 years. Simple maintenance can often be performed locally if the model is commonly used (such as for screen repairs and battery replacement).
If a tablet (or phone) is lost or stolen, a police report should be required.
Two challenges for digital data collection in remote areas are lack of electricity and lack of internet connectivity. When the electrical grid is unavailable and unstable, devices can be charged using solar panels, battery packs, or even car batteries.
Tech Tip: If a battery is removed from a device for charging, it will reset the device date. After charging, make sure to verify the device is set to the correct date.
When internet connectivity is not available locally, community workers can be asked to travel weekly to a location with connectivity, often near a cell phone tower or at an internet café. Paper forms may also be used to substitute digital forms when the assigned cell phones are not available because of damage, loss, or lack of electricity. When phone calls and texts fail as a means of communication, an in-person visit must be scheduled. This can require bus fare, motorbike/bicycle transport, or car transport. It is recommended to have some budget allocated for this.
Deploying the Digital Devices
At roll out, configuring numerous cell phones and tablets is a significant task. Information technology personnel should enlist supervisors and central team members to assist in the initial setup and configuration. This has the added benefit of familiarizing the staff with basic operation and support of the devices and software. This includes connecting the devices to Google accounts and selecting the appropriate language of the devices, as well as installing various applications. In COMSA/SIS-COVE, applications included ODK Collect for data collection, Geopaparazzi for GPS services, and TeamViewer, which allowed for remote IT support.
Tech Tip: Device IDs should be documented in the database so that it is easy to track devices sent to provinces, and then assigned to interviewers and data collectors. Data collection softaware generally captures the Device ID. This provides another avenue for tracking phones and data collector activity.
Unique Identifiers
Unique identifiers (IDs) are used in the data collection system to uniquely identify data collectors, participants, events, geographic areas, and data table rows. They are structured strings of alphanumeric characters. IDs can be formatted for either: human readability or machine readability.
Human Readable IDs
When identifiers are regularly used by people, they should be optimized for human handling (rather than computer processing), meaning that they:
-
Are short and have a limited character set: This helps ensure that they will be more easily and accurately read, remembered, and typed. A limited character set will reduce errors from misreading values. For SIS-COVE, we only used uppercase letters and numbers. These characters (I O Q U V W ) were dropped to avoid confusion with similar letters or numbers. For example, “I” can easily be confused with the number “1”, etc.
-
Have a distinct format: This allows quick visual identification of type, such as making it easy to distinguish the ID of a data collector from that of a work area.
-
Incorporate relationships: Some entities are related to each other, such as clusters within a province or family members within a household. It can be helpful to incorporate those relationships into the identifier. For example, a province might have an ID of “03”. For a cluster within that province, we might choose to create a compound ID that incorporates the provinceID. Cluster “079” could have a unique identifier of “AT03079”
In addition, because of its critical nature, we designed the data collector IDs to resist typographical errors by incorporating a checksum. A checksum is a numeric value derived from the specified data. SISCOVE used a checksum similar to a Luhn algorithm. The ASCII code values of the ID characters when multiplied and divided systematically will produce a consistent remainder value. If the checksum does not match this value, there is at least one error in the entered ID characters.
A critical challenge in community surveillance is assigning and maintaining household and individual IDs that allow easy follow up and linking of events recorded to the households and individuals. Mozambique initiated the IDs by assigning ID stickers to every household during the population household listing. However, in the long run many IDs get lost due to population movements. SIS-COVE relied primarily on the names of heads of households, and selected characteristics to identify households in each cluster.
Table 9: Examples of COMSA/SIS-COVE Human Readable Unique IDs 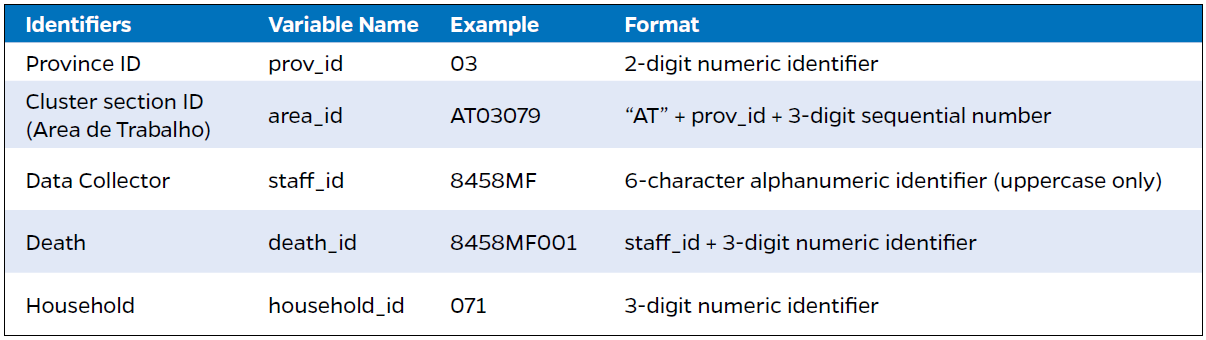
| Last updated |
|---|
| Feb 28, 2026 |