Statistical Domains, Sampling Design, and Sample Size
Step 4
The statistics measured through an SMSS, such as mortality rates, are representative at the national level, provincial or district levels depending on the choice of statistical domains, sampling design, and sample size. Statistical domains consist of geographic areas or subpopulations for which estimates will be generated with sufficient precision. Typical statistical domains are regions or provinces, but it may also be possible to include all or selected districts. However, the more the domains, the higher the sample size. Deciding on the statistical domains is a key decision for the functioning of the system, as well as its cost. Once this determination has been made, it is possible to calculate sample size.
Deciding on the Statistical Domains of Representativeness
In general, countries want data at the smallest health implementation unit level, such as the district, to support local planning and decision-making. However, for mortality and relatively rare outcomes, the cost of generating continuous data at every district level can be prohibitive. It is critical during the design of the SMSS to reach a consensus on the domain level at which the statistical estimates will be produced.
Domains can consist of all or selected level one administrative areas, such as provinces and regions, and selected districts for which the government and stakeholders would like to have data to support specific programs. Stratification may also be done by urban and rural areas. Specific sub-national areas may be oversampled to support needed and relevant disaggregated analysis or improved precision of the mortality rates or other indicators. Such decisions must be made in consultation with the government, stakeholders and implementing institutions. In deciding on the domain, it is essential to keep in mind that the more domains are defined, the larger the ultimate sample will be and the more costly the system will be. There must be a compromise between the resources available, the feasibility of data collection, and the number of domains, all guided by the purpose of the system levels.
Sampling Frame
A sampling frame is a complete updated list of small geographic units covering the entire country and includes information on total population (or total households) per unit and main stratifiers such provinces or regions, districts, urban and rural areas, major cities, and villages, etc. These geographic units should be small enough to serve as geographic clusters for the SMSS. A complete sampling frame is required to establish the list of geographic clusters from which to draw the sample.
A recent population census provides an ideal data source for rigorous selection of clusters. It is important to assess the completeness and the quality of the sampling frame and clearly define what would be considered a cluster. A population census frame includes population and households disaggregated by enumeration areas (EAs). EAs often have population size of 100 to 150 households, depending on whether the area is urban or rural. EAs may be considered as clusters. However, larger areas that include 2-3 EAs may also be considered as geographic clusters to reduce the number of clusters needed in the SMSS, while still making it feasible for a community worker to visit each household every one to two months. When defining clusters, it is essential to ensure that they have well-defined and physically identifiable boundaries to facilitate effective surveillance and monitoring. Decisions regarding cluster definition should consider the availability of population data at the cluster level, cluster size and geographic boundaries. Also keep in mind that clusters that are too small may be unstable over time and require more frequent population updates than clusters that are relatively large.
COMSA/SIS-COVE Example
In Mozambique, SIS-COVE uses clusters composed of groups of 2-3 EAs that represented control areas during the 2007 population census and had about 300 households. It was expected that a resident enumerator could cover a control area of approximately 300 households (about 1500 population). In fact, there was considerable variation in population size across defined control areas. This requires splitting some control areas during the sampling stage.
Sample Design: Selecting Clusters
The sampling design must account for the statistical domains being considered, as described in step 3. The sampling frame should be organized according to the defined clusters (EAs or group of EAs, or villages), covering exhaustively all the domains and strata. Strategies for the selection of the clusters within the domains and stratum include simple random selection or multi-stage cluster sampling. A simple random sampling may be appropriate if clusters are all generally about the same size. The approach will generate a self-weighted sample which therefore will not require the use of sampling weights. However, this approach can produce a biased sample if there are large size differences between the clusters. Furthermore, a simple random sample, although most efficient, may not be practical for the study team if the strata are very large and selected clusters are far apart. If clusters differ in population size, the sample can be drawn using a systematic random sampling with probability proportionate to size. This requires computing sampling weights to adjust estimates computed from the sample. Very large clusters can be further segmented, and one segment can be selected. An alternative to sample random sampling will involve multi-stage sampling. A two-stage sampling will involve selecting districts within provinces at a first stage, followed by the selection of clusters within selected districts. These stages will be selected with probability proportionate to size in terms of population or number of households. To maintain accuracy, the sample must be revisited and periodically examined to ensure that it is still representative of the initial domains.
Urban areas present additional challenges for surveillance. Often the population in high socio-economic status areas are not accessible to the surveillance team; for example, they may be inside gated communities. This is especially true in capital cities and large metropolitan areas. Using data from the population census, the high and inaccessible socio-economic and administrative areas in large metropolitan areas may be identified and excluded from the sample of clusters prior to the selection of the sample. In general, it is expected that the population in these areas would be small. In most countries, it will be essential to work with experts from the national institute of statistics who are familiar with the country’s administrative structure and the sampling frame and will be able to give advice on the best sampling strategy. It is also essential to conduct several sampling trials before arriving at a satisfactory sample. The final sample must also be discussed with the Ministry of health and key stakeholders to ensure that it addresses their specific needs and requirements.
Sample Size Calculation
Baseline mortality estimates are needed to determine the number of clusters and the sample size. Reliable and recent mortality data at the national and sub-national levels must be used. The choice of a mortality indicator and its precision must be carefully made to obtain a sufficient sample size that allows for estimating other priority indicators with acceptable precision. Typically, child mortality indicators will yield a sufficient size if an acceptable precision is used. Demographic and Health Surveys data may be used if a recent survey is available. Such data are used to compute national and subnational estimates of infant and under-five mortality for periods of five years preceding the survey. These estimates can be then projected to the year of the start of the SMSS (for baseline mortality) using an estimate on mortality trends, such as from modeled UN estimates 1 or a good and reasonable empirical estimate of mortality trends. The sample size estimate considers parameters of precision (margin of error) as well as practicality, with the need to ensure data quality, sustainability and affordability. Key indicators of interest for the SMSS are the neonatal, infant, under-five, and adult mortality rates and related cause of death fractions and rates. The sample size and the number of clusters reflect the need for adequate precision or margin of error for these indicators over a reference period, preferably annually, and measurement domains such as provinces or regions. Although it would be desirable to power the sample to detect annual changes in mortality and cause-specific mortality rates in each domain, doing so would lead to a large and unsustainable sample size, particularly in provinces or regions with low mortality burden. For indicators such as maternal mortality ratio, it may be useful to consider subnational estimates that are computed over a period of at least two years to ensure a large enough sample size for estimation per domain. The precision of the sample size can be estimated in terms of percentage relative standard error (PRSE). The choice of PRSE will depend on the level of mortality estimate, keeping in mind that smaller margins of error will yield a large and impractical number of clusters. Depending on the country’s mortality indicators, the needs of and requests from the government, some subnational areas (e.g selected regions or provinces with high or low mortality) may be oversampled to generate annual mortality rate estimates and precise estimates of cause-specific mortality fractions and rates. We recommend reviewing and revising the sample size every 3-5 years to ensure that the vital statistics produced have acceptable precision. The availability of a new population census offers an opportunity for such reviews, including taking steps to redress and augment the SMSS sample to continue to be representative of the statistical domains selected.
Illustrative Example to Sample Size Calculation
Often, because of the strong interest in monitoring mortality among children under the age of five, under-five mortality rate (U5MR) can be used to estimate the overall sample size. For community surveillance of births and deaths, U5MR is often approximated by dividing the number of annual under-five deaths with the number of annual births. Thus, a binomial probability model is a good approximation for sample size calculations. This approach is conservative and will also yield enough sample for other age-specific mortality rates. The following formula can be used to estimate a sample size per statistical domain.
Parameters
- m = baseline mortality rate
- d = desired margin of error (often also referred to as precision)
- α = confidence level, generally taken as 0.05
- deff = design effect
- f = non-response rate (at household level)
- CBR = Crude birth rate
- h = Average household size
- c = Average number of households per cluster
The estimated number of annual births is obtained by:
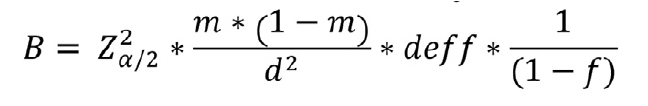
B can be converted to the corresponding number of households n as:
The corresponding number of clusters N is obtained as:
If there are multiple domains, arriving at a satisfactory and feasible sample size of clusters will require relaxing the margin of error by reducing the precision of the estimate. While at the national level, the sample size would be enough to estimate the mortality rates with good precision, when disaggregated by domain the precision will be reduced substantially.
Sample Size Computation for COMSA/SIS-COVE
The sample size was estimated based on projected infant mortality rate (IMR) in each province for 2016, using annual rate of reduction estimated by the UN-IGME between 2000 and 2010. The estimates of IMR were obtained from the 2011 DHS. We used 7 deaths per 1000 live births as error margin in the four provinces with highest under-five mortality, corresponding to a relative error margin (absolute error margin divided by the IMR) between 11% and 17%. For the remaining provinces, we used a relative error margin between 25% and 30%. Based on these assumptions, the total number of clusters for the SMSS was estimated at 700. Given the prevalent mortality levels, the system was expected to capture annually 2,649 under-five deaths, 1,805 infant deaths and 9,230 total deaths. In each of the four high burden provinces, the projected U5MR for 2016 ranged between 72 and 90 deaths per 1000 live births, which could be measured with a precision of ±8 per 1000 live births.
Figure 1: Sample size calculation for COMSA/SIS-COVE 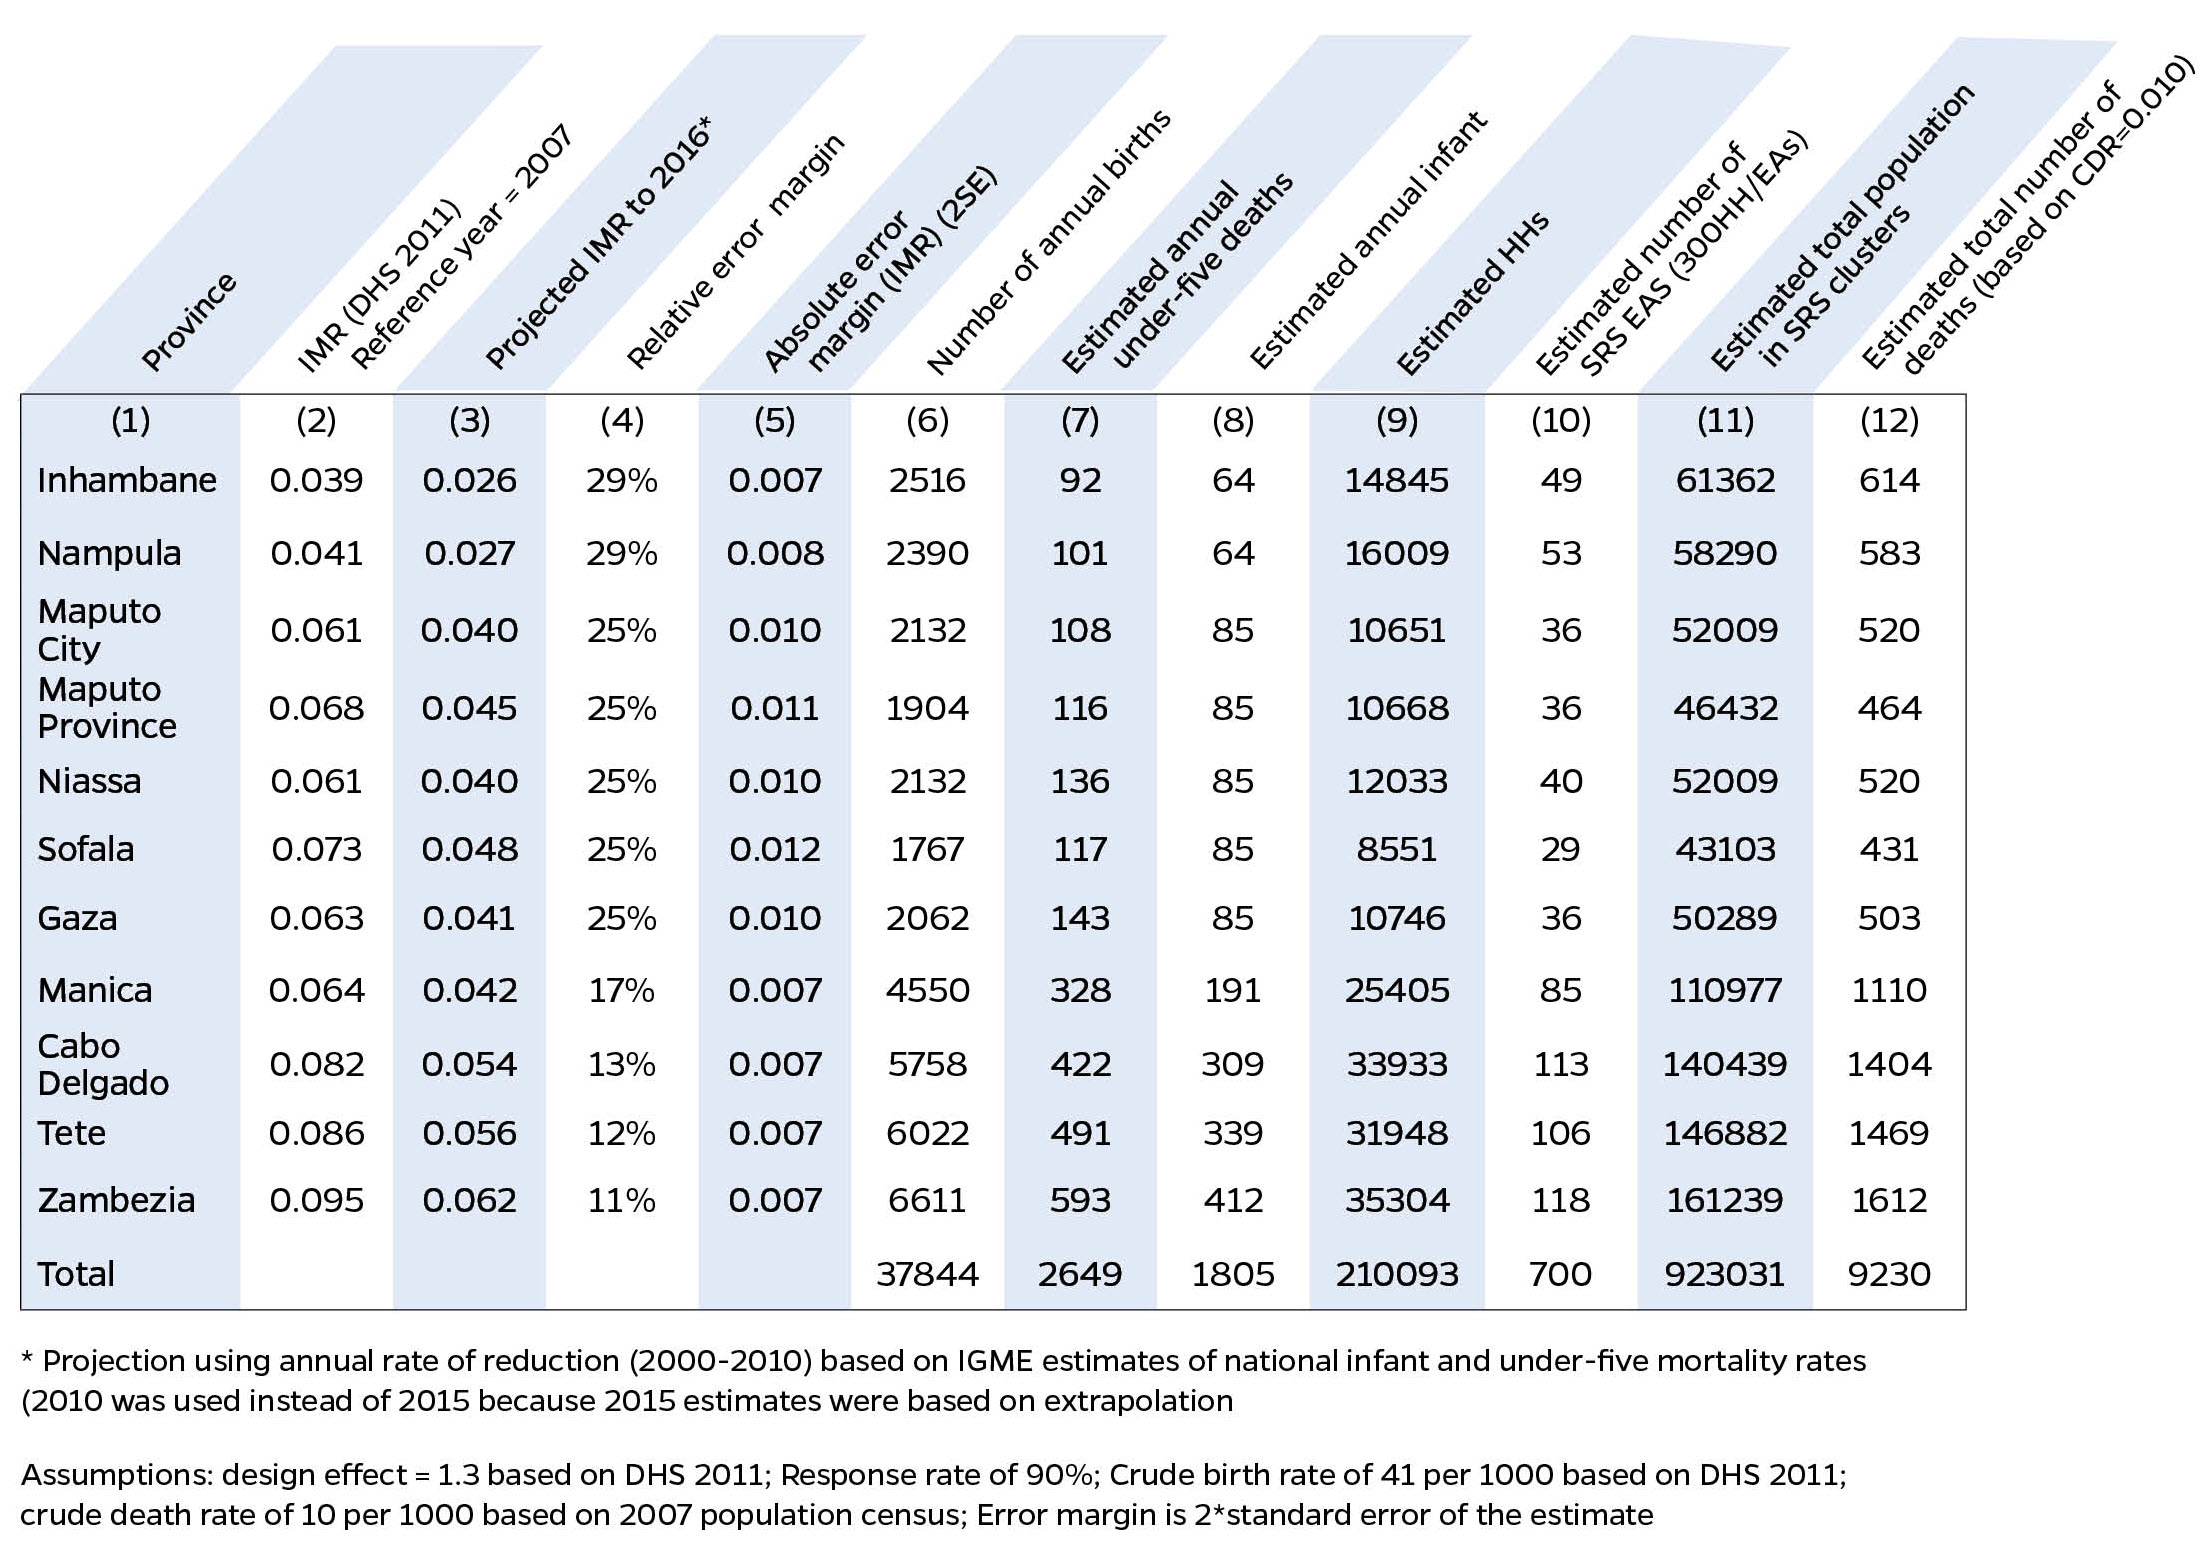
To Learn More:
| Last updated |
|---|
| Apr 21, 2026 |