Mapping tools and GPS
Geopapparzi, Qfield, ODK, QGIS, ArcGIS, Google Maps
Introduction
GPS is used extensively in SMSS to identify geographic boundaries, to record household locations, and to verify data collection location. During baseline cluster planning, cartographers will use tools to generate polygon overlays that can be used throughout the project. During the intitial Census, data collectors can use interactive maps on their tablets or phones to verify they are within the cluster boundaries when they capture household locations. During routine data collection, GPS data can be used to confirm household identity and to verify the data collector is visiting households in person.
The tools used in this work fall into a few categories:
Collecting GPS data points
Most offline data collection platforms offer this feature. This software interacts with the android device GPS system to collect longitude, latitude, altitude and accuracy. ODK Collect, Survey Solutions interviewer, Redcap mobile are examples of systems that have this feature.
ODK example: Collecting a GPS data point within a form 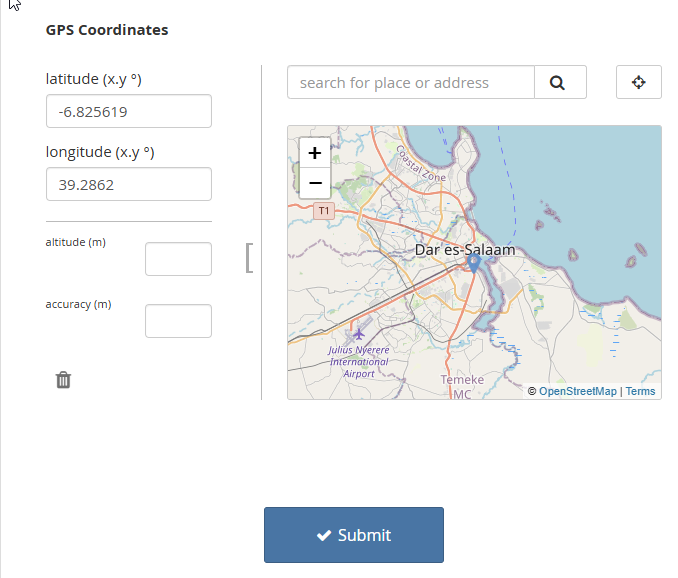
It is possible to capture GPS points on almost any smartphone without any specialized software. And there are many specialized devices for capturing GPS data. However, it is a best practice to incorporate GPS data capture directly into data collection forms. This allows GPS data to be directly connected to household and member’s information.
Using cluster polygons and household GPS data points in the field
Several offline data collection platforms (such as ODK Collect or Survery Solutions Interviewer) can show known households on a map and can assist data collectors in navigating to them. However, these systems are NOT designed to work on large scale offline projects. The are limited to several hundred GPS data points. In a national SMSS, a system would likely contain more than 100,000 household locations.
ODK Collect data collector view with plotted households 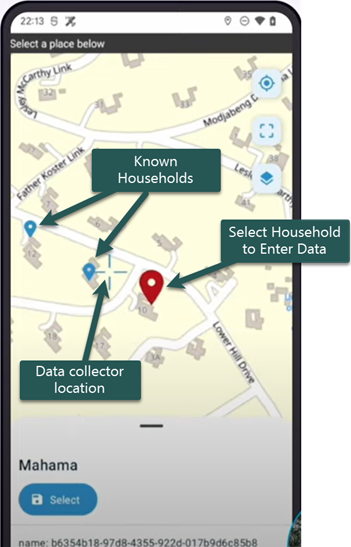
This is a great way to connect a household to an event or any follow-up data collection. However, this is currently limited by scale. Most interactive mapping tools can only handle a few hundred GPS points at a time. If the SMSS has thousands homes or tens of thousands of homes, the GPS data cannot be loaded all together. It can be divided into working areas with smaller groups of homes, ideally less than 300 at a time. The scale may change over time. It is important to field-test these options to verify workability.
Tech Tip: Interactive maps are generally limited to small number of GPS points. Around 300 or fewer generally has good performance. If you’re planning to plot home locations on a map, you’ll have to limit the group size.
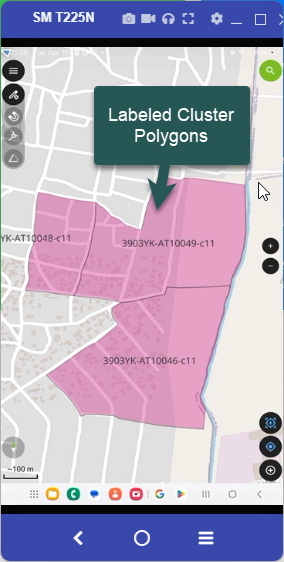
Other field tools include: Geoparazzi and Qfield These apps can be preloaded with a basemap, polygon boundaries, and lists of households or other important locations. They can work completely offline and still access satellites. The data collector can use the apps to see where they are within a cluster and can identify home locations.
Qfield data collector view: Cluster Polygon
Data monitoring and analysis
GIS software can provide a powerful tools for visualizing and accessing Vital Event and Cause of Death data. Google maps and QGIS are two examples that offer extensive feaures.
Google maps provides API based tools that can be integrated directly into websites and offline devices.
Project website with integrated google maps 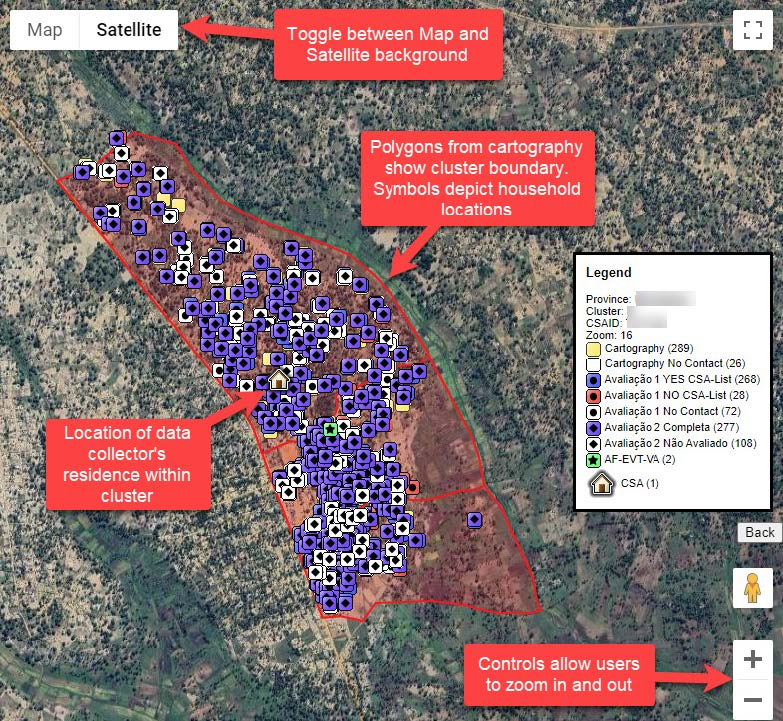
QGIS offers a comprehensive desktop system for integrating GIS maps and data. It has an offline tool called Qfield which can be used to integrate android data collection devices. QGIS is open source, and it is comparable to the proprietary ArcGIS platform.
QGIS desktop view: plotting and adjusting cluster boundaries 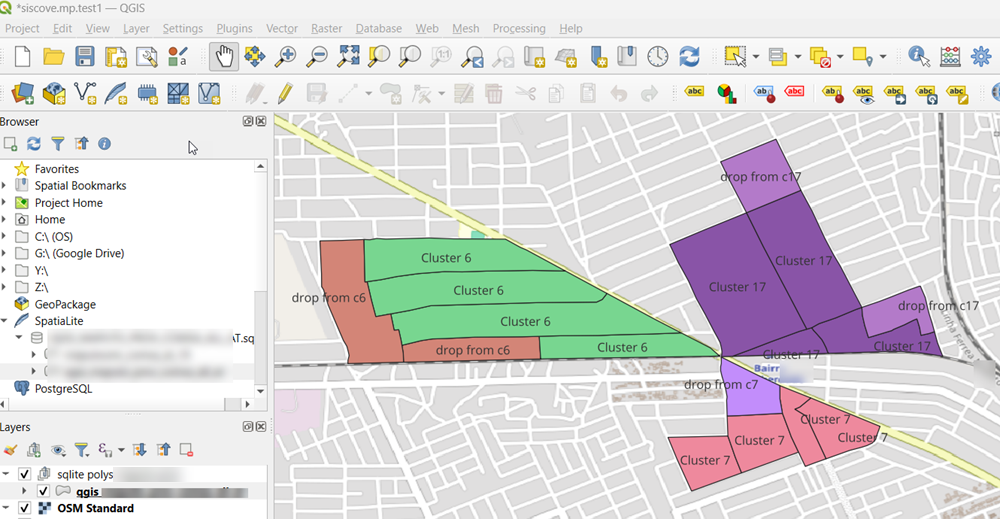
| Last updated |
|---|
| May 19, 2025 |